
Engineering Documentation
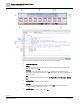
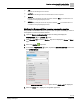
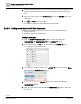
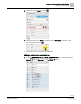
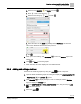
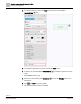
Table Of Contents
- Copyright Notice
- 1 About this document
- 2 Desigo Control Point Operation engineering topics
- 2.1 Tool-free configuration of a Desigo Control Point device
- 2.1.1 Connecting to the Desigo Control Point device
- 2.1.2 Performing the initial login
- 2.1.3 Configuring the Network port for IP (PXG3.Wx00 and PXM… touch panel)
- 2.1.4 Activating the application (PXG3.Wx00 and PXM… touch panel)
- 2.1.5 Assigning devices to the Desigo Control Point device
- 2.1.6 Updating the Network port for a browser connection (PXM… touch panel)
- 2.1.7 Subscribing to the time master and time synchronization for Assigned devices
- 2.1.8 Configuring for kiosk graphics on a touch panel
- 2.2 Tool-free commissioning of the Operation application
- 2.3 Data point integration overview
- 2.4 Plant view Tools
- 2.4.1 Using the graphics wizard to create a graphic
- 2.4.2 Editing a graphic
- 2.4.3 Removing a graphic
- 2.4.4 Displaying the URL of a graphic
- 2.4.5 Exporting graphics for sharing across jobs
- 2.4.6 Importing graphics
- 2.4.7 Enabling graphics and kiosks for room users to view
- 2.4.8 Defining graphics as a startup page
- 2.5 Working with kiosk graphics
- 2.6 Using engineering notations
- 2.1 Tool-free configuration of a Desigo Control Point device
- 3 Graphics engineering with Graphics Builder
- 3.1 Graphics Builder overview
- 3.2 Using the Builder pane tools
- 3.3 Graphics libraries
- 3.4 Workflows
- 3.5 Working with dashboards
- 3.5.1 The Facility manager dashboard user interface
- 3.5.2 The Public dashboard user interface
- 3.5.3 Adding and editing a text box
- 3.5.4 Adding or replacing a background image
- 3.5.5 Adding information from a trended data point
- 3.5.6 Adding external media to a dashboard
- 3.5.7 Working with gauges
- 3.5.8 Editing charts
- 3.6 Creating end-user room graphics
- 3.7 Advanced functionality
- 4 Tips and tricks
- 4.1 Updates required after a time zone change
- 4.2 APPLY BATCH TAGS > Custom Filter button is reserved for future use
- 4.3 Graphic components within models cannot be modified
- 4.4 A graphic with relative binding that includes data points from different branches of the hierarchy cannot be created at the Root level
- 4.5 Relative hyperlinks cannot be added to a graphic at the Root level
- 4.6 Relative hyperlinks in a graphic are broken if the graphic is engineered offline and then imported to another device
- 4.7 Haystack interface
- 4.8 Automatic logout from the Operation application causes Graphics Builder to temporarily stop working
- Index

Graphics engineering with Graphics Builder
Working with dashboards
92 | 138
Siemens
A6V11211560_enUS_b
Building Technologies
2019-01-15
② Changing the location displayed in the Weather layer
This procedure replaces the existing HTML code for the Ractive component in the
Weather layer. The default settings for the Weather layer are as follows:
● Location: Chicago, United States of America.
● Number of days: Four
● Temperature unit: Fahrenheit
● Wind speed unit: mph
1. Go to https://www.meteoblue.com/en/weather. From the left menu, select the
widget you would like to integrate.
2. Select the options to configure your widget.
3. When the widget is configured, copy the HTML code in the field at the bottom of
the page.
4. In Graphics Builder, display the LAYERS pane and expand the Weather layer.
5. Select the Ractive component in the Weather layer.
6. In the BASIC PROPERTIES pane, expand the RACTIVE EDITOR section and
click OPEN EDITOR.
The RACTIVE EDITOR dialog box opens with the TEMPLATE tab displayed.
7. Paste the new HTML code in the TEMPLATE tab.
8. So that the widget is scaled to fit the dashboard frame, change the width and
height to 100% instead of px (pixels).
For additional details, see the Adding external media to a dashboard [➙ 105] section.
③ Adding a data source to the Energy and Water layers
A trended data point must be added to the Energy and Water layers to provide data for
the comparison of the building resource consumption to common household devices.
Icons for the household devices do not display until a trended data point has been
added to the layer.
ⓐ Adding a trend definition for online trended objects
If the trend is already defined, skip to
ⓑ Adding a trended data point to the Energy and
Water layers
.
Note
To add a trend definition for offline trended objects, you must use the commissioning
program for the device, such as ABT Pro, and then download the objects to the
automation station.
In the Operation application, Trends is selected in the core function pane.
1. Select > > Configure trend definitions > .
2. Navigate through the building hierarchy and select the object(s) to trend.
Only objects that currently do not have a trend definition are displayed.
3. Click Next.