
Engineering Documentation
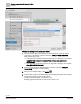
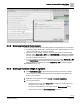
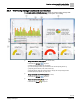
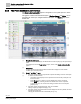
Table Of Contents
- Copyright Notice
- 1 About this document
- 2 Desigo Control Point Operation engineering topics
- 2.1 Tool-free configuration of a Desigo Control Point device
- 2.1.1 Connecting to the Desigo Control Point device
- 2.1.2 Performing the initial login
- 2.1.3 Configuring the Network port for IP (PXG3.Wx00 and PXM… touch panel)
- 2.1.4 Activating the application (PXG3.Wx00 and PXM… touch panel)
- 2.1.5 Assigning devices to the Desigo Control Point device
- 2.1.6 Updating the Network port for a browser connection (PXM… touch panel)
- 2.1.7 Subscribing to the time master and time synchronization for Assigned devices
- 2.1.8 Configuring for kiosk graphics on a touch panel
- 2.2 Tool-free commissioning of the Operation application
- 2.3 Data point integration overview
- 2.4 Plant view Tools
- 2.4.1 Using the graphics wizard to create a graphic
- 2.4.2 Editing a graphic
- 2.4.3 Removing a graphic
- 2.4.4 Displaying the URL of a graphic
- 2.4.5 Exporting graphics for sharing across jobs
- 2.4.6 Importing graphics
- 2.4.7 Enabling graphics and kiosks for room users to view
- 2.4.8 Defining graphics as a startup page
- 2.5 Working with kiosk graphics
- 2.6 Using engineering notations
- 2.1 Tool-free configuration of a Desigo Control Point device
- 3 Graphics engineering with Graphics Builder
- 3.1 Graphics Builder overview
- 3.2 Using the Builder pane tools
- 3.3 Graphics libraries
- 3.4 Workflows
- 3.5 Working with dashboards
- 3.5.1 The Facility manager dashboard user interface
- 3.5.2 The Public dashboard user interface
- 3.5.3 Adding and editing a text box
- 3.5.4 Adding or replacing a background image
- 3.5.5 Adding information from a trended data point
- 3.5.6 Adding external media to a dashboard
- 3.5.7 Working with gauges
- 3.5.8 Editing charts
- 3.6 Creating end-user room graphics
- 3.7 Advanced functionality
- 4 Tips and tricks
- 4.1 Updates required after a time zone change
- 4.2 APPLY BATCH TAGS > Custom Filter button is reserved for future use
- 4.3 Graphic components within models cannot be modified
- 4.4 A graphic with relative binding that includes data points from different branches of the hierarchy cannot be created at the Root level
- 4.5 Relative hyperlinks cannot be added to a graphic at the Root level
- 4.6 Relative hyperlinks in a graphic are broken if the graphic is engineered offline and then imported to another device
- 4.7 Haystack interface
- 4.8 Automatic logout from the Operation application causes Graphics Builder to temporarily stop working
- Index

Graphics engineering with Graphics Builder
Working with dashboards
84 | 138
Siemens
A6V11211560_enUS_b
Building Technologies
2019-01-15
4. Click Apply.
5. Click SAVE and close the graphic.
3.5 Working with dashboards
Dashboards are a specific application of graphics that display trend data and present
values in elements, such as bar charts, pie charts and gauges. Dashboards only
display information—they do not contain elements for commanding objects.
When working with dashboards, it is recommended that you start with a sample
dashboard from the Supersample graphics library and use SAVE AS GRAPHIC to
save your customized version. The Supersample graphics library contains the following
sample dashboard graphics:
● Sample dashboard facility manager, which provides a facility manager with detailed
information regarding the energy consumption of a building
The Facility manager dashboard user interface [➙ 85]
● Sample dashboard public, which is designed for use in public spaces to share
information about a building.
The Public dashboard user interface [➙ 90]
The sample dashboard graphics have been designed to require minimal set-up. Most
users only need to add trend definitions for the data to be displayed and add the data
sources to the graphic.
Configuring the Facility manager dashboard [➙ 86]
Configuring the Public dashboard [➙ 91]
Navigation in Graphics Builder and the procedures to import, export and edit
dashboard graphics are the same as with any other graphic. Creating new dashboard
graphics (rather than starting with a sample graphic) is an advanced task. See the
following sections of this manual for more information:
● Importing graphics [➙ 36]
● Exporting graphics for sharing across jobs [➙ 35]
● Editing a graphic [➙ 34]
● Using the graphics wizard to create a graphic [➙ 33]