
Engineering Documentation
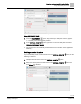
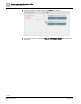
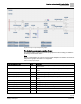
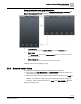
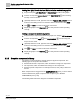
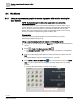
Table Of Contents
- Copyright Notice
- 1 About this document
- 2 Desigo Control Point Operation engineering topics
- 2.1 Tool-free configuration of a Desigo Control Point device
- 2.1.1 Connecting to the Desigo Control Point device
- 2.1.2 Performing the initial login
- 2.1.3 Configuring the Network port for IP (PXG3.Wx00 and PXM… touch panel)
- 2.1.4 Activating the application (PXG3.Wx00 and PXM… touch panel)
- 2.1.5 Assigning devices to the Desigo Control Point device
- 2.1.6 Updating the Network port for a browser connection (PXM… touch panel)
- 2.1.7 Subscribing to the time master and time synchronization for Assigned devices
- 2.1.8 Configuring for kiosk graphics on a touch panel
- 2.2 Tool-free commissioning of the Operation application
- 2.3 Data point integration overview
- 2.4 Plant view Tools
- 2.4.1 Using the graphics wizard to create a graphic
- 2.4.2 Editing a graphic
- 2.4.3 Removing a graphic
- 2.4.4 Displaying the URL of a graphic
- 2.4.5 Exporting graphics for sharing across jobs
- 2.4.6 Importing graphics
- 2.4.7 Enabling graphics and kiosks for room users to view
- 2.4.8 Defining graphics as a startup page
- 2.5 Working with kiosk graphics
- 2.6 Using engineering notations
- 2.1 Tool-free configuration of a Desigo Control Point device
- 3 Graphics engineering with Graphics Builder
- 3.1 Graphics Builder overview
- 3.2 Using the Builder pane tools
- 3.3 Graphics libraries
- 3.4 Workflows
- 3.5 Working with dashboards
- 3.5.1 The Facility manager dashboard user interface
- 3.5.2 The Public dashboard user interface
- 3.5.3 Adding and editing a text box
- 3.5.4 Adding or replacing a background image
- 3.5.5 Adding information from a trended data point
- 3.5.6 Adding external media to a dashboard
- 3.5.7 Working with gauges
- 3.5.8 Editing charts
- 3.6 Creating end-user room graphics
- 3.7 Advanced functionality
- 4 Tips and tricks
- 4.1 Updates required after a time zone change
- 4.2 APPLY BATCH TAGS > Custom Filter button is reserved for future use
- 4.3 Graphic components within models cannot be modified
- 4.4 A graphic with relative binding that includes data points from different branches of the hierarchy cannot be created at the Root level
- 4.5 Relative hyperlinks cannot be added to a graphic at the Root level
- 4.6 Relative hyperlinks in a graphic are broken if the graphic is engineered offline and then imported to another device
- 4.7 Haystack interface
- 4.8 Automatic logout from the Operation application causes Graphics Builder to temporarily stop working
- Index

Graphics engineering with Graphics Builder
Workflows
80 | 138
Siemens
A6V11211560_enUS_b
Building Technologies
2019-01-15
3.4 Workflows
3.4.1 Using a supersample graphic to create a graphic with relative binding for
your system
NOTE: the instructions given in this section apply only to room Automation
supersample graphics.
Supersample graphics may be used without modification to view the status of your
system. However, each time a graphic is displayed, the application takes additional
time to determine which components are not used and then hide them from the
display. This section outlines how to modify a supersample graphic to more closely
match your system and optimize the graphic rendering time.
Prerequisite
Determine which supersample graphic most closely matches your system.
Supersample graphics library [➙ 74]
Using a supersample graphic to create a relativized graphic
1. If a graphic is currently displayed, click Root or an item in the breadcrumb list to
close it.
2. Select > Tools > Configure graphics > Edit .
The Configure graphics – Edit dialog box displays all graphics in the Operation
application.
3. Select the supersample graphic that most closely matches your system and click
Edit.
Graphics Builder opens the selected graphic in a new tab.
4. Select MENU > SAVE AS GRAPHIC , enter a unique file name and click SAVE.
Note: You are not prevented from assigning the same graphic name to multiple
graphics.
The new file name displays in the tab for the graphic.