
Engineering Documentation
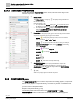
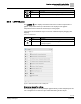
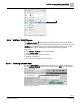
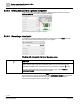
Table Of Contents
- Copyright Notice
- 1 About this document
- 2 Desigo Control Point Operation engineering topics
- 2.1 Tool-free configuration of a Desigo Control Point device
- 2.1.1 Connecting to the Desigo Control Point device
- 2.1.2 Performing the initial login
- 2.1.3 Configuring the Network port for IP (PXG3.Wx00 and PXM… touch panel)
- 2.1.4 Activating the application (PXG3.Wx00 and PXM… touch panel)
- 2.1.5 Assigning devices to the Desigo Control Point device
- 2.1.6 Updating the Network port for a browser connection (PXM… touch panel)
- 2.1.7 Subscribing to the time master and time synchronization for Assigned devices
- 2.1.8 Configuring for kiosk graphics on a touch panel
- 2.2 Tool-free commissioning of the Operation application
- 2.3 Data point integration overview
- 2.4 Plant view Tools
- 2.4.1 Using the graphics wizard to create a graphic
- 2.4.2 Editing a graphic
- 2.4.3 Removing a graphic
- 2.4.4 Displaying the URL of a graphic
- 2.4.5 Exporting graphics for sharing across jobs
- 2.4.6 Importing graphics
- 2.4.7 Enabling graphics and kiosks for room users to view
- 2.4.8 Defining graphics as a startup page
- 2.5 Working with kiosk graphics
- 2.6 Using engineering notations
- 2.1 Tool-free configuration of a Desigo Control Point device
- 3 Graphics engineering with Graphics Builder
- 3.1 Graphics Builder overview
- 3.2 Using the Builder pane tools
- 3.3 Graphics libraries
- 3.4 Workflows
- 3.5 Working with dashboards
- 3.5.1 The Facility manager dashboard user interface
- 3.5.2 The Public dashboard user interface
- 3.5.3 Adding and editing a text box
- 3.5.4 Adding or replacing a background image
- 3.5.5 Adding information from a trended data point
- 3.5.6 Adding external media to a dashboard
- 3.5.7 Working with gauges
- 3.5.8 Editing charts
- 3.6 Creating end-user room graphics
- 3.7 Advanced functionality
- 4 Tips and tricks
- 4.1 Updates required after a time zone change
- 4.2 APPLY BATCH TAGS > Custom Filter button is reserved for future use
- 4.3 Graphic components within models cannot be modified
- 4.4 A graphic with relative binding that includes data points from different branches of the hierarchy cannot be created at the Root level
- 4.5 Relative hyperlinks cannot be added to a graphic at the Root level
- 4.6 Relative hyperlinks in a graphic are broken if the graphic is engineered offline and then imported to another device
- 4.7 Haystack interface
- 4.8 Automatic logout from the Operation application causes Graphics Builder to temporarily stop working
- Index

Graphics engineering with Graphics Builder
Using the Builder pane tools
70 | 138
Siemens
A6V11211560_enUS_b
Building Technologies
2019-01-15
3.2.4.2 Binding data points to a graphic component
To bind data points to a graphic component, drag-and-drop the data point from the
VIRTUAL POINTS pane onto the graphic component.
Figure 6: Binding a data point to a graphic component.
3.2.4.3 Renaming a virtual point
To rename the virtual point within the graphic, modify the text in the Name field. This
only changes the virtual point name in the current graphic.
Working with data points that have the same name
NOTICE
Adding multiple data points with an indistinct name, such as
valve
, without using
REFORMAT NAME creates a nested structure in the VIRTUAL POINTS pane.
If you are working with data points that have the same name, select TOOLS >
REFORMAT NAME each time a data point is added.
For example, two data points are named valve; one is the valve for the cooling coil,
and the other is the valve for the preheater. Using REFORMAT NAME after each data
point is added automatically renames the virtual point based on the application
hierarchy and keeps the names in proper order.