
Engineering Documentation
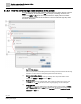
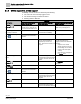
Table Of Contents
- Copyright Notice
- 1 About this document
- 2 Desigo Control Point Operation engineering topics
- 2.1 Tool-free configuration of a Desigo Control Point device
- 2.1.1 Connecting to the Desigo Control Point device
- 2.1.2 Performing the initial login
- 2.1.3 Configuring the Network port for IP (PXG3.Wx00 and PXM… touch panel)
- 2.1.4 Activating the application (PXG3.Wx00 and PXM… touch panel)
- 2.1.5 Assigning devices to the Desigo Control Point device
- 2.1.6 Updating the Network port for a browser connection (PXM… touch panel)
- 2.1.7 Subscribing to the time master and time synchronization for Assigned devices
- 2.1.8 Configuring for kiosk graphics on a touch panel
- 2.2 Tool-free commissioning of the Operation application
- 2.3 Data point integration overview
- 2.4 Plant view Tools
- 2.4.1 Using the graphics wizard to create a graphic
- 2.4.2 Editing a graphic
- 2.4.3 Removing a graphic
- 2.4.4 Displaying the URL of a graphic
- 2.4.5 Exporting graphics for sharing across jobs
- 2.4.6 Importing graphics
- 2.4.7 Enabling graphics and kiosks for room users to view
- 2.4.8 Defining graphics as a startup page
- 2.5 Working with kiosk graphics
- 2.6 Using engineering notations
- 2.1 Tool-free configuration of a Desigo Control Point device
- 3 Graphics engineering with Graphics Builder
- 3.1 Graphics Builder overview
- 3.2 Using the Builder pane tools
- 3.3 Graphics libraries
- 3.4 Workflows
- 3.5 Working with dashboards
- 3.5.1 The Facility manager dashboard user interface
- 3.5.2 The Public dashboard user interface
- 3.5.3 Adding and editing a text box
- 3.5.4 Adding or replacing a background image
- 3.5.5 Adding information from a trended data point
- 3.5.6 Adding external media to a dashboard
- 3.5.7 Working with gauges
- 3.5.8 Editing charts
- 3.6 Creating end-user room graphics
- 3.7 Advanced functionality
- 4 Tips and tricks
- 4.1 Updates required after a time zone change
- 4.2 APPLY BATCH TAGS > Custom Filter button is reserved for future use
- 4.3 Graphic components within models cannot be modified
- 4.4 A graphic with relative binding that includes data points from different branches of the hierarchy cannot be created at the Root level
- 4.5 Relative hyperlinks cannot be added to a graphic at the Root level
- 4.6 Relative hyperlinks in a graphic are broken if the graphic is engineered offline and then imported to another device
- 4.7 Haystack interface
- 4.8 Automatic logout from the Operation application causes Graphics Builder to temporarily stop working
- Index

Graphics engineering with Graphics Builder
Graphics Builder overview
58 | 138
Siemens
A6V11211560_enUS_b
Building Technologies
2019-01-15
3.1.3.2 The GRAPHIC ON query
The GRAPHIC ON field in the SAVE PROJECT dialog box displays a query string. For
example, the query string area and equip and roomSegment uses semantic tags that
make the graphic available for all room segments in the building structure.
Table 10: Types of binding queries.
Binding query
Type of binding
Notes
baUniqueId
Fixed for a specific application on a specific system
device.
This type of query stays constant within a device unless the
application structure is changed. It is useful for one-time
solutions.
navName
Fixed for a specific application on a specific system
device.
This type of query can be engineered to be reused.
shortName
Can be reused with similar applications and other
system devices.
This type of query is proprietary to a system.
semantic tags
Can be reused with similar applications and other
system devices.
This type of query can be used across systems and is
extensible by the RC Library.
Occasionally, the semantic tags that are automatically applied during data point
integration are insufficient to identify a specific data point. For example, when you view
the GRAPHIC ON query for a plant, you find that only the equip tag was applied during
data point integration. If additional tags are added to the GRAPHIC ON query, the
graphic is recognized in more locations of the building structure.
● Manually adjusting the GRAPHIC ON query maintains the relative data point
binding.
● You may need to add tags that are typically not used for the query, such as
navName.
● Alternately, you may add an engineering notation in the Operation application that
uniquely identifies the data point.
Using engineering notations [➙ 46]
3.1.3.3 Relativizing a graphic to use on another system device
This topic outlines tips for creating a relativized graphic for reuse on other Desigo
Control Point devices that have the same or similar applications.
● Always use semantic tags that follow the Haystack conventions.
– During data point integration, semantic tags are automatically applied to all
supported standard applications.
Data point binding [➙ 55]
– Graphics in the supersample graphics library are already relativized. Refer to
these graphics to create your own graphic that contains a superset of the
components in your system.
Supersample graphics library [➙ 74]
● Semantic tags are not automatically applied to third-party devices or devices with
non-standard applications.
– To automatically apply semantic tags to these devices, create your own tag
mapping table and store it in your local library before the data points are
integrated. This is an advanced workflow.
– You may need to re-bind the graphic each time it is imported to a new Desigo
Control Point device. See the following procedure.
Rebinding graphics for third-party devices or non-standard applications