
Engineering Documentation
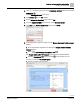
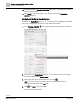
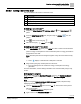
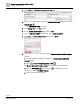
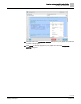
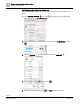
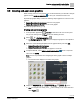
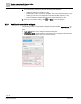
Table Of Contents
- Copyright Notice
- 1 About this document
- 2 Desigo Control Point Operation engineering topics
- 2.1 Tool-free configuration of a Desigo Control Point device
- 2.1.1 Connecting to the Desigo Control Point device
- 2.1.2 Performing the initial login
- 2.1.3 Configuring the Network port for IP (PXG3.Wx00 and PXM… touch panel)
- 2.1.4 Activating the application (PXG3.Wx00 and PXM… touch panel)
- 2.1.5 Assigning devices to the Desigo Control Point device
- 2.1.6 Updating the Network port for a browser connection (PXM… touch panel)
- 2.1.7 Subscribing to the time master and time synchronization for Assigned devices
- 2.1.8 Configuring for kiosk graphics on a touch panel
- 2.2 Tool-free commissioning of the Operation application
- 2.3 Data point integration overview
- 2.4 Plant view Tools
- 2.4.1 Using the graphics wizard to create a graphic
- 2.4.2 Editing a graphic
- 2.4.3 Removing a graphic
- 2.4.4 Displaying the URL of a graphic
- 2.4.5 Exporting graphics for sharing across jobs
- 2.4.6 Importing graphics
- 2.4.7 Enabling graphics and kiosks for room users to view
- 2.4.8 Defining graphics as a startup page
- 2.5 Working with kiosk graphics
- 2.6 Using engineering notations
- 2.1 Tool-free configuration of a Desigo Control Point device
- 3 Graphics engineering with Graphics Builder
- 3.1 Graphics Builder overview
- 3.2 Using the Builder pane tools
- 3.3 Graphics libraries
- 3.4 Workflows
- 3.5 Working with dashboards
- 3.5.1 The Facility manager dashboard user interface
- 3.5.2 The Public dashboard user interface
- 3.5.3 Adding and editing a text box
- 3.5.4 Adding or replacing a background image
- 3.5.5 Adding information from a trended data point
- 3.5.6 Adding external media to a dashboard
- 3.5.7 Working with gauges
- 3.5.8 Editing charts
- 3.6 Creating end-user room graphics
- 3.7 Advanced functionality
- 4 Tips and tricks
- 4.1 Updates required after a time zone change
- 4.2 APPLY BATCH TAGS > Custom Filter button is reserved for future use
- 4.3 Graphic components within models cannot be modified
- 4.4 A graphic with relative binding that includes data points from different branches of the hierarchy cannot be created at the Root level
- 4.5 Relative hyperlinks cannot be added to a graphic at the Root level
- 4.6 Relative hyperlinks in a graphic are broken if the graphic is engineered offline and then imported to another device
- 4.7 Haystack interface
- 4.8 Automatic logout from the Operation application causes Graphics Builder to temporarily stop working
- Index

Graphics engineering with Graphics Builder
Working with dashboards
114 | 138
Siemens
A6V11211560_enUS_b
Building Technologies
2019-01-15
10. Navigate back to the PROGRAM EDITOR dialog box in your graphic and paste the
contents of the program.
11. Click SAVE to save the program in your graphic and close the PROGRAM
EDITOR dialog box.
④
(Optional)
Modifying the chart labels
By default, the displayName string tag for each data point is displayed as the label
in the chart. Complete this procedure for each label to be modified.
1. In the VIRTUAL POINTS pane, find the data point for the label to be modified
and click to display all of its tags.
2. Scroll down to the displayName string tag and select its value. (In the Figure,
the value is initially named Present value.)
3. Change the value to the desired label name and click .
Hint: If you want to refer to the device name to create the label name, it is
displayed two fields above in the dis field.
4. Click and Save to save the graphic.
The pie chart has been added.