
Engineering Documentation
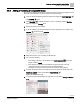
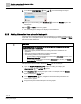
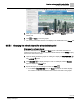
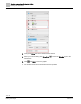
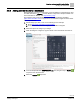
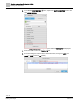
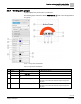
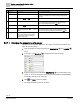
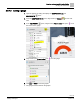
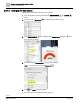
Table Of Contents
- Copyright Notice
- 1 About this document
- 2 Desigo Control Point Operation engineering topics
- 2.1 Tool-free configuration of a Desigo Control Point device
- 2.1.1 Connecting to the Desigo Control Point device
- 2.1.2 Performing the initial login
- 2.1.3 Configuring the Network port for IP (PXG3.Wx00 and PXM… touch panel)
- 2.1.4 Activating the application (PXG3.Wx00 and PXM… touch panel)
- 2.1.5 Assigning devices to the Desigo Control Point device
- 2.1.6 Updating the Network port for a browser connection (PXM… touch panel)
- 2.1.7 Subscribing to the time master and time synchronization for Assigned devices
- 2.1.8 Configuring for kiosk graphics on a touch panel
- 2.2 Tool-free commissioning of the Operation application
- 2.3 Data point integration overview
- 2.4 Plant view Tools
- 2.4.1 Using the graphics wizard to create a graphic
- 2.4.2 Editing a graphic
- 2.4.3 Removing a graphic
- 2.4.4 Displaying the URL of a graphic
- 2.4.5 Exporting graphics for sharing across jobs
- 2.4.6 Importing graphics
- 2.4.7 Enabling graphics and kiosks for room users to view
- 2.4.8 Defining graphics as a startup page
- 2.5 Working with kiosk graphics
- 2.6 Using engineering notations
- 2.1 Tool-free configuration of a Desigo Control Point device
- 3 Graphics engineering with Graphics Builder
- 3.1 Graphics Builder overview
- 3.2 Using the Builder pane tools
- 3.3 Graphics libraries
- 3.4 Workflows
- 3.5 Working with dashboards
- 3.5.1 The Facility manager dashboard user interface
- 3.5.2 The Public dashboard user interface
- 3.5.3 Adding and editing a text box
- 3.5.4 Adding or replacing a background image
- 3.5.5 Adding information from a trended data point
- 3.5.6 Adding external media to a dashboard
- 3.5.7 Working with gauges
- 3.5.8 Editing charts
- 3.6 Creating end-user room graphics
- 3.7 Advanced functionality
- 4 Tips and tricks
- 4.1 Updates required after a time zone change
- 4.2 APPLY BATCH TAGS > Custom Filter button is reserved for future use
- 4.3 Graphic components within models cannot be modified
- 4.4 A graphic with relative binding that includes data points from different branches of the hierarchy cannot be created at the Root level
- 4.5 Relative hyperlinks cannot be added to a graphic at the Root level
- 4.6 Relative hyperlinks in a graphic are broken if the graphic is engineered offline and then imported to another device
- 4.7 Haystack interface
- 4.8 Automatic logout from the Operation application causes Graphics Builder to temporarily stop working
- Index

Graphics engineering with Graphics Builder
Working with dashboards
108 | 138
Siemens
A6V11211560_enUS_b
Building Technologies
2019-01-15
Property
Description
Property can be modified
⑤
Precision
The number of decimal places displayed.
Yes
Value
The present value displayed
No
This value is overwritten when a BACnet object is dropped onto
the gauge.
Value color
Color of the Value and Unit.
Yes
⑥
Label
Title for the gauge.
No
When a BACnet object is dropped onto the gauge, the object
name is automatically entered in the Label field.
Title color
Color of the Label.
Yes
⑦
Unit
Unit of measure for the Value. The Value
color also applies to this field.
No
When a BACnet object is dropped onto the gauge, the unit of
measure for the object is automatically entered in the Unit field.
⑧
Gauge fill
The color displayed indicates if the present
value is in the minimum range (green),
moderate range (yellow-to-orange) or
maximum range (red).
No
3.5.7.1 Changing the appearance of a gauge
This procedure changes the appearance of a gauge and its labels, and allows you to
adjust the operating range.
1. Open the graphic for editing and display the PROPERTIES and LAYERS
panes.
2. If necessary, click Show/hide to display the layer with the gauge.
3. Select the gauge and use the BASIC PROPERTIES to edit the labels, scale,
colors, etc. For more information, see the Figure
Gauge BASIC PROPERTIES
in
the Working with gauges [➙ 107] topic.
4. Click and Save to save the graphic.
The gauge appearance has been modified.