
Engineering Documentation
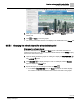
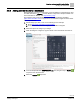
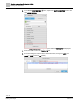
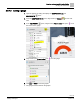
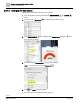
Table Of Contents
- Copyright Notice
- 1 About this document
- 2 Desigo Control Point Operation engineering topics
- 2.1 Tool-free configuration of a Desigo Control Point device
- 2.1.1 Connecting to the Desigo Control Point device
- 2.1.2 Performing the initial login
- 2.1.3 Configuring the Network port for IP (PXG3.Wx00 and PXM… touch panel)
- 2.1.4 Activating the application (PXG3.Wx00 and PXM… touch panel)
- 2.1.5 Assigning devices to the Desigo Control Point device
- 2.1.6 Updating the Network port for a browser connection (PXM… touch panel)
- 2.1.7 Subscribing to the time master and time synchronization for Assigned devices
- 2.1.8 Configuring for kiosk graphics on a touch panel
- 2.2 Tool-free commissioning of the Operation application
- 2.3 Data point integration overview
- 2.4 Plant view Tools
- 2.4.1 Using the graphics wizard to create a graphic
- 2.4.2 Editing a graphic
- 2.4.3 Removing a graphic
- 2.4.4 Displaying the URL of a graphic
- 2.4.5 Exporting graphics for sharing across jobs
- 2.4.6 Importing graphics
- 2.4.7 Enabling graphics and kiosks for room users to view
- 2.4.8 Defining graphics as a startup page
- 2.5 Working with kiosk graphics
- 2.6 Using engineering notations
- 2.1 Tool-free configuration of a Desigo Control Point device
- 3 Graphics engineering with Graphics Builder
- 3.1 Graphics Builder overview
- 3.2 Using the Builder pane tools
- 3.3 Graphics libraries
- 3.4 Workflows
- 3.5 Working with dashboards
- 3.5.1 The Facility manager dashboard user interface
- 3.5.2 The Public dashboard user interface
- 3.5.3 Adding and editing a text box
- 3.5.4 Adding or replacing a background image
- 3.5.5 Adding information from a trended data point
- 3.5.6 Adding external media to a dashboard
- 3.5.7 Working with gauges
- 3.5.8 Editing charts
- 3.6 Creating end-user room graphics
- 3.7 Advanced functionality
- 4 Tips and tricks
- 4.1 Updates required after a time zone change
- 4.2 APPLY BATCH TAGS > Custom Filter button is reserved for future use
- 4.3 Graphic components within models cannot be modified
- 4.4 A graphic with relative binding that includes data points from different branches of the hierarchy cannot be created at the Root level
- 4.5 Relative hyperlinks cannot be added to a graphic at the Root level
- 4.6 Relative hyperlinks in a graphic are broken if the graphic is engineered offline and then imported to another device
- 4.7 Haystack interface
- 4.8 Automatic logout from the Operation application causes Graphics Builder to temporarily stop working
- Index

Graphics engineering with Graphics Builder
Working with dashboards
102 | 138
Siemens
A6V11211560_enUS_b
Building Technologies
2019-01-15
9. In the BASIC PROPERTIES , click Lock to lock the background layer.
10. When you’re done editing, click Show/hide to return the Weather layer to the
default view.
11. Click and Save to save the graphic.
The new background image now displays in the dashboard.
3.5.5 Adding information from a trended data point
Information from a trended data point can be displayed in a summary graphic, such as
a pie chart, or in a comparison chart, such as those displayed in the Energy and Water
tabs of the Public dashboard.
NOTICE
For optimum system performance, do the following when defining trends for data
points that are used in dashboards:
● Select the longest possible interval for saving data that is suitable for the
application.
● Select the shortest possible time for keeping trend data.
● The following selections are recommended:
For the Facility manager dashboard pie chart data, Save every 12 hours, and
Delete trend data after 2 months.
For the Public dashboard bar chart data, Save every 15 minutes, and Delete
trend data after 12 months.
This procedure uses the Public dashboard Energy tab as an example.
1. Open the Sample dashboard public graphic for editing and display the
EQUIPMENTS and LAYERS panes.
2. Click Show/hide to display the layer to edit. For example, hide the Weather
layer and display the Energy layer.
3. In the EQUIPMENTS pane, navigate to the trended data point that is the
source for the graphic.
4. Drag-and-drop the trended data point onto the graphic.