Desigo Control Point Engineering Manual for Americas Region A6V11211560_enUS_b 2019-01-15 Building Technologies
Edition notice Edition notice Technical specifications and availability subject to change without notice. This document may not be reproduced, disseminated to third parties or processed and its contents may not be used or disclosed without express permission. Non-compliance shall result in compensation for damages. All rights, including those resulting from a successful patent application and registration of a utility model or design patent, are reserved.
About this document Cyber security disclaimer Copyright Notice Notice Document information is subject to change without notice by Siemens Industry, Inc. Companies, names, and various data used in examples are fictitious unless otherwise noted. No part of this document may be reproduced or transmitted in any form or by any means, electronic or mechanical, for any purpose, without the express written permission of Siemens Industry, Inc.
About this document Trademarks Oracle and Java are trademarks or registered trademarks of Oracle America, Inc. Further to the notes in this section, and to facilitate the reading of the text, these trademarks will not be indicated elsewhere in the text by use of symbols, such as ® or ™. .
Table of Contents Copyright Notice ......................................................................................................... 3 Cyber security disclaimer ................................................................................................ 3 Trademarks ..................................................................................................................... 3 1 About this document .......................................................................................
2.5 2.4.4 Displaying the URL of a graphic .......................................................... 35 2.4.5 Exporting graphics for sharing across jobs .......................................... 35 2.4.6 Importing graphics ............................................................................... 36 2.4.7 Enabling graphics and kiosks for room users to view .......................... 37 2.4.8 Defining graphics as a startup page ....................................................
3.3.3 3.4 Graphics components library ............................................................... 78 Workflows ............................................................................................................ 80 3.4.1 Using a supersample graphic to create a graphic with relative binding for your system .................................................................................................... 80 3.5 3.4.2 Creating graphics for touch panels .......................................
4.4 Graphic components within models cannot be modified ................................... 135 4.5 A graphic with relative binding that includes data points from different branches of the hierarchy cannot be created at the Root level ................................................... 135 4.6 Relative hyperlinks cannot be added to a graphic at the Root level ................. 135 4.7 Relative hyperlinks in a graphic are broken if the graphic is engineered offline and then imported to another device ...
About this document Trademarks Siemens Building Technologies 1 9 | 138 A6V11211560_enUS_b 2019-01-15
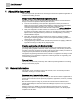
About this document General information 1 About this document This manual provides procedures for the Desigo Control Point Operation application. It contains the following sections: Desigo Control Point Operation engineering topics This section outlines topics for the Operation application that are not included in the Desigo Control Point Operation Manual (A6V11211557).
About this document Target readers Quality assurance These documents were prepared with great care. ● The contents of all documents are checked at regular intervals. ● Any corrections necessary are included in subsequent versions. ● Documents are automatically amended as a consequence of modifications and corrections to the products described. Please make sure that you are aware of the latest document revision date. 1.
Desigo Control Point Operation engineering topics Tool-free configuration of a Desigo Control Point device 2 Desigo Control Point Operation engineering topics This section provides the following information: • Tool-free configuration of the Desigo Control Point device • Tool-free commissioning of the Operation application • Operation application procedures that are not included in the Desigo Control Point Operation Manual (A6V11211557) 2.
Desigo Control Point Operation engineering topics Tool-free configuration of a Desigo Control Point device ⓑConnect using the embedded Web server and a standard Web browser 1. Connect to the USB port of the Desigo Control Point device. 2. Type the IP address 192.168.250.1 in the address bar of a browser. The Desigo Web login page displays. 2.1.2 Performing the initial login 1. Login using the Administrator account. 2.
Desigo Control Point Operation engineering topics Tool-free configuration of a Desigo Control Point device 4. Modify the settings for IP configuration. See the following table for more information. Setting Description Read community string Community string that allows reading information from a device. Network number Number that identifies the network. Default: 0 UDP port UDP Port number that the service uses to communicate. Default: 47808 5.
Desigo Control Point Operation engineering topics Tool-free configuration of a Desigo Control Point device Setting Description Active system language User interface language for the application. Default: The language selected on the login page. Object naming convention Naming format of the BACnet objects. Only Hierarchical, standard names apply for Desigo Control Point. Select application 2.1.
Desigo Control Point Operation engineering topics Tool-free configuration of a Desigo Control Point device 2.1.6 Updating the Network port for a browser connection (PXM… touch panel) Prerequisite (PXMx0-1 only) ● Complete this prerequisite if you are using a remote connection from a PXMx0-1 touch panel to an Desigo Control Point device. In this case, an http connection must be allowed. Otherwise, a certificate error will occur after a power cycle. ● If you are using a PXMx0.
Desigo Control Point Operation engineering topics Tool-free configuration of a Desigo Control Point device 4. For Home Url, enter the URL for the default graphic that should display on the touch panel after a power cycle: – – If you are using a remote connection from a PXM touch panel to an Desigo Control Point device, use the following format: http://[IP_address]/[graphic_name] If you are using a PXMx0.E touch panel, change the IP address in the URL to localhost.
Desigo Control Point Operation engineering topics Tool-free configuration of a Desigo Control Point device 2.1.8 Configuring for kiosk graphics on a touch panel If the site uses a PXM... touch panel to display kiosk graphics, configure the touch panel to allow certain users to stay logged in. CAUTION System access for kiosk user profiles should be restricted to kiosk functions. This procedure sets up a user profile that never automatically logs out.
Desigo Control Point Operation engineering topics Tool-free commissioning of the Operation application 2.2 Tool-free commissioning of the Operation application Use the workflow in this section to set up user accounts, add email recipients, configure network and alarm settings and integrate data points. See the ABT Site online help under Online > Workflows for the complete configuration and commissioning workflow. Complete Steps 1 through 7 on a computer.
Desigo Control Point Operation engineering topics Tool-free commissioning of the Operation application Setting Description Date format Select a date format. For example, DD.MM.YYYY, YYYY/MM/DD or MM-DD-YYYY. Time format Select the 24h or 12h time format. Possible next step: Configuring email recipients [➙ 20] 2.2.2 Configuring email recipients This procedure adds email addresses for those who are allowed to receive emails from Desigo Control Point. 1. Select > > Configure email recipients > .
Desigo Control Point Operation engineering topics Tool-free commissioning of the Operation application SMTP settings dialog box. Setting Description SMTP server The name of the SMTP server being used to route emails. For example, smtp.gmail.com. User name The user name of an account that is allowed to send emails using the SMTP server. For example, username@gmail.com. Password The password for the specified account that is allowed to send emails.
Desigo Control Point Operation engineering topics Tool-free commissioning of the Operation application Possible next step: Configuring settings for Alarms [➙ 22] 2.2.5 Configuring settings for Alarms This section configures the following settings for Alarms: ● Alarm polling By default, the database is polled every two seconds. Polling every two seconds may not be necessary at some sites and may impact the performance of other activities taking place in the system.
Desigo Control Point Operation engineering topics Tool-free commissioning of the Operation application Table 3: Configure alarm history dialog box. Setting Description Purge if older than The default setting is 1 year. Time for purge ● Amount field: Valid entries are numbers greater than 0. ● Unit of measure drop-down list: Days, Weeks, Months, Years or All. The default setting is Daily, –, –.
Desigo Control Point Operation engineering topics Tool-free commissioning of the Operation application 2.2.6 Configuring alarm routing This procedure configures alarm routing so that recipients only receive the information that applies to them. For example, a selected list of recipients only receives emails for alarms that occur on weekends or during a specific timeframe. Alarms is selected in the core function pane. 1. Select > > Configure alarm routing > . 2.
Desigo Control Point Operation engineering topics Tool-free commissioning of the Operation application Setting Description Days Route alarms on the selected day(s) during the selected time range. Default: No days are selected Priority range Priority or range of priorities where: ● Entering a single priority (for example, 100) only routes alarms or events of that priority.
Desigo Control Point Operation engineering topics Data point integration overview 2.2.8 Setting the touch panel screen orientation This procedure saves the touch panel screen orientation. Power is connected to the touch panel. 1. Tap the Orientation icon to select a screen orientation. 2. To display the browser bar, swipe from top to bottom. 3. Type the IP address of the Desigo Control Point device in the address bar. 4. Login and log out of the touch panel to save the screen orientation.
Desigo Control Point Operation engineering topics Data point integration overview 2.3.1 Data point integration user interface ① Desigo Control Point device description and % of device capacity that is used by integrated data points The model of Desigo Control Point device determines the total number of BACnet objects that can be integrated. ② Default integration level The default integration level is configured in the Data point integration settings and applies to DXRs only.
Desigo Control Point Operation engineering topics Data point integration overview ⑨ Filled Percent of the Desigo Control Point device capacity used by this device. ⑩ Integration level This selection determines how many DXR BACnet objects are imported into the Desigo Control Point device during data point integration. Change the integration level for an individual DXR by selecting a new value from the drop-down list.
Desigo Control Point Operation engineering topics Data point integration overview 2.3.2 Tree view for devices being monitored The workflow used for data point integration determines where a device displays in the Operation application tree view. The following figure shows the tree view for devices that were integrated using the Tool-free (online) workflow. Figure 1: Tree view for devices being monitored. 2.3.
Desigo Control Point Operation engineering topics Data point integration overview 2.3.3.1 Using the Advanced integration function After the data points from a device have been integrated to the Desigo Control Point device, the Advanced integration manually adds or removes individual BACnet objects for monitoring. For example, you can select Basic operation as the Integration level for an individual DXR. After data points from the DXR are integrated, you can manually add objects to use for troubleshooting.
Desigo Control Point Operation engineering topics Plant view Tools 2.3.4 Resolving errors related to data point integration Complete this procedure if a cache or integration error occurs. 1. Manually remove the device in ABT-SSA: – Select > Setup & Service > Assigned devices. – Select Assigned devices in the work area and click – – Click for the device with the error. Click Delete to confirm the action. to open Edit mode. 2.
Desigo Control Point Operation engineering topics Plant view Tools User interface ① Root icon and breadcrumb navigation Click Root to navigate back to the top level of the building structure and only display building level graphics. ② Next level in the navigation Click the Object name or the navigation arrow to display graphics in lower levels of the building structure.
Desigo Control Point Operation engineering topics Plant view Tools ③ Additional object properties Click the icon for the object type (ⓐ), for example , to open the “magic bubbles” (ⓑ), which display additional object properties that are used for engineering graphics. Click Tags to copy the tags for the object to the clipboard. Click baUniqueId Click Name to copy the baUniqueId for the object to the clipboard. to display the shortName, navName, Object name and nodeSubType for the object.
Desigo Control Point Operation engineering topics Plant view Tools 6. Click Next. 7. For relative binding, the GRAPHIC ON filter field is displayed. Make modifications, if desired, and click Next. A list of available equipment and data points displays. 8. Select the objects that should display on the graphic and click Next. The system creates the graphic. 9. Click OK to clear the message. The graphic opens in Graphics Builder for further editing.
Desigo Control Point Operation engineering topics Plant view Tools 2.4.3 Removing a graphic The Tools menu is context-sensitive. ● Selecting Remove from the Plant view page displays a list of graphics, and you can select one or more graphics to remove. ● Selecting Remove while viewing a graphic removes the graphic you are currently viewing. Removing graphics 1. Select > Tools > Configure graphics > Remove . The Configure Graphics – Remove dialog box displays the graphics that can be removed. 2.
Desigo Control Point Operation engineering topics Plant view Tools Note When exporting graphics, you may need to allow the browser to accept pop-ups. Do the following to enable popups in a Chrome browser: 1. At the top right corner of the window, click Customize and control > Settings. 2. Scroll to the bottom of the page and expand the Advanced section. 3. In the Privacy and security section, expand Content settings. 4. Select Pop-ups and set the Blocked/Allowed switch to Allowed. 5.
Desigo Control Point Operation engineering topics Plant view Tools 2.4.7 Enabling graphics and kiosks for room users to view Room users can only view graphics and kiosks that have been enabled in the Desigo Control Point device. The model of Desigo Control Point device determines the total number of graphics and kiosks that can be enabled. 1. Select > Tools > Enable/disable graphics & kiosks. The Enable/disable graphics & kiosks dialog box indicates how many graphics and kiosks are enabled. 2.
Desigo Control Point Operation engineering topics Plant view Tools 2.4.8 Defining graphics as a startup page Graphics that are defined as a startup page are the default view for a particular level of the building structure. This feature helps to maintain relative references if you are using hyperlinks to navigate between graphics. 1. Select > Tools > Define startup page. The Define startup page dialog box displays all graphics in the Operation application. 2.
Desigo Control Point Operation engineering topics Working with kiosk graphics 2.5 Working with kiosk graphics A site may use a PXM... touch panel to display kiosk graphics. A kiosk graphic can be a single interactive graphic that allows users to command data points or a slideshow that displays a collection of graphics. ● The browser bar does not display when graphics are displayed in an active kiosk. ● Thumbnail images are currently not supported for kiosks.
Desigo Control Point Operation engineering topics Working with kiosk graphics 2.5.2 Workflow for configuring a kiosk presentation Workflow step 1 Configuring a user account for the kiosk operator [➙ 40] 2 Configuring the touch panel for kiosk operation [➙ 40] 3 Configuring a kiosk graphic [➙ 41] 4 2.5.2.
Desigo Control Point Operation engineering topics Working with kiosk graphics 2.5.2.3 Configuring a kiosk graphic This procedure creates a kiosk presentation which specifies the type of kiosk graphic (interactive or slideshow) and the type of data point binding (relative or absolute). Note When working at the Root level of the building structure, you can only create a kiosk presentation with absolute binding. The option to select the type of data point binding does not display.
Desigo Control Point Operation engineering topics Working with kiosk graphics ① Name field Type a new name to rename the kiosk graphic. ② KIOSK ON filter field Modify the KIOSK ON filter to change the equip or site where the components bind to display values and states. ③ Select graphic list box Select the interactive graphic to display for this kiosk. ④ Select target for this graphic list box Select the equip or site where the components bind to display values and states.
Desigo Control Point Operation engineering topics Working with kiosk graphics Editing kiosk properties ① Name field Type a new name to rename the kiosk graphic. ② KIOSK ON filter field Modify the KIOSK ON filter to change the equip or site where the components bind to display values and states. Adding slides ① Select the graphic to display in the slideshow. ② The equip or site where the components bind to display values and states.
Desigo Control Point Operation engineering topics Working with kiosk graphics Editing slides 44 | 138 Siemens Building Technologies ① The graphic name. ② The equip or site where the components bind to display values and states. ● A single graphic with relative binding may be viewed on multiple, similar targets. ● A graphic with absolute binding can only be viewed on the one, specific target for which it was engineered. ③ The number of seconds each slide displays.
Desigo Control Point Operation engineering topics Working with kiosk graphics Removing slides 1. Select the slide(s) to remove from the slideshow. 2. Click Remove and click OK to confirm the removal. 2.5.2.4 Activating a kiosk presentation CAUTION Never activate the kiosk while logged in under an advanced-access user account, such as an administrator or engineer. Always activate the kiosk while logged in with the kiosk room operator user account.
Desigo Control Point Operation engineering topics Using engineering notations 2.5.4 Logging out of a kiosk This procedure is only available to users who have been granted access to log out of the kiosk. 1. Tap the upper left corner of the touch panel and then, consecutively, within 30 seconds, tap the lower right corner of the touch panel. The logout screen displays 2. Enter the User name and password of the currently logged-in user to authorize logging out and ending the kiosk session.
Desigo Control Point Operation engineering topics Using engineering notations 3. In the top section of the dialog box, select the equipment to which an engineering notation is being added. 4. In the middle section of the dialog box, select the data point(s) to which an engineering notation is being added. 5. Type the engineering notation in the engNotation key value field. 6. Click Apply. 7. Display the magic bubbles to verify the engineering notations.
Desigo Control Point Operation engineering topics Using engineering notations Editing an engineering notation 1. Open the List view and navigate to the level of the building structure where the equipment and/or data points with an engineering notation reside. 2. Select > Tools > Edit engineering notation > Edit . All engineering notation tags at the selected location in the building structure are displayed. 3. Edit the tag information and click Apply. Removing an engineering notation 1.
Graphics engineering with Graphics Builder Graphics Builder overview 3 Graphics engineering with Graphics Builder Plant view graphics are created using the Graphics Builder application, which is accessed through the Operation application when working online, and through ABT Site when working offline. Graphics Builder contains sample graphics and additional tools to help you easily create graphics to meet the needs of your facility.
Graphics engineering with Graphics Builder Graphics Builder overview 3.1.1 Graphics Builder user interface ① Builder pane Builder panes provide tools for building graphics or display information about the graphic that is currently open. Builder pane icons [➙ 51] Click Properties in the pane heading to view a different pane or to arrange the selected pane.
Graphics engineering with Graphics Builder Graphics Builder overview ③ Currently not used. ④ PREVIEW button Click to preview the graphic that is currently open. Animated components are active and objects that depend on the context display. For example, a room segment graphic displays the correct number of light controls for the currently-selected location in the building structure. ⑤ Graphic tabs A tab displays the name of each graphic that is currently open. Click Close ⑥ 3.1.1.
Graphics engineering with Graphics Builder Graphics Builder overview 3.1.1.2 Command bar and MENU icons The command bar and MENU flyout contain basic tools, such as copy, paste, save, open, and drawing shapes. Indicator Name Key combination Description NEW GRAPHIC – Opens an empty graphic page. OPEN GRAPHIC – Opens graphics from the current project. SAVE GRAPHIC CTRL+S Saves and publishes the current graphic. SAVE AS GRAPHIC Only available in the MENU flyout.
Graphics engineering with Graphics Builder Graphics Builder overview Indicator 3.1.2 Name Key combination Description VIEW DATABASE – Query records, tags, components, data points and any other objects that can be queried from within the graphic. This query only checks records within the graphic. HIDE/SHOW PANEL – Toggle button to display or hide the Builder panes on the left side of the screen.
Graphics engineering with Graphics Builder Graphics Builder overview 3.1.2.2 How the semantic tags create structure in the system Semantic tags are used to open a graphic in the context of a target, which is a specific equip (for example, an AHU plant) or site (for example, a building). Therefore, the target is the equip or site where the components bind to display values and states. The following figure provides more information on how the semantic tags help create structure in the system.
Graphics engineering with Graphics Builder Graphics Builder overview ⑤ Data points Every data point in the system has a point or shadowPoint tag. Data points also have one of the following tags to identify its type: ● cmd, which classifies a data point as an output, AO/BO, command, or actuator. ● sensor, which classifies a data point as an input, AI/BI, or sensor. ● sp, which classifies a data point as a setpoint, soft point or process control variable.
Graphics engineering with Graphics Builder Graphics Builder overview 3.1.3.1 Types of binding queries Absolute by Point id binding Absolute by Point id binding has a hardcoded ID. For example, id==@1eeaf88482cd6356. ● ● ● Absolute by Point id binding is recommended for graphics that contain specific data from exact equipment. Common examples include a Plant, custom equipment, and summary-style equipment graphics.
Graphics engineering with Graphics Builder Graphics Builder overview ● the query looks for a data point with the same tags, and loads the information for the data point it identifies. When a graphic with Relative by Tags binding is saved, the GRAPHIC ON field in the dialog box displays a query string. For example, area and equip and roomSegment, which makes the graphic available for all room segments in the building structure NOTICE Relative by Tags binding is not recommended for new servers.
Graphics engineering with Graphics Builder Graphics Builder overview 3.1.3.2 The GRAPHIC ON query The GRAPHIC ON field in the SAVE PROJECT dialog box displays a query string. For example, the query string area and equip and roomSegment uses semantic tags that make the graphic available for all room segments in the building structure. Table 10: Types of binding queries. Binding query Type of binding Notes baUniqueId Fixed for a specific application on a specific system device.
Graphics engineering with Graphics Builder Graphics Builder overview 1. Open the EQUIPMENTS pane. 2. Drag-and-drop the appropriate data points to re-bind them to the graphic components. An absolute binding is created, which adapts the graphic to the structure of the new application. 3. To relativize the binding, right-click on the graphic component or smart label and select TOOLS > RELATIVIZE. 4. Select a building structure location to create the relative reference and click APPLY. 5.
Graphics engineering with Graphics Builder Graphics Builder overview 3.1.4 Offline support vs. online support Availability of some functions is affected by the following: ● The user role of the currently logged in user. ● The model of Desigo Control Point device. ● Working offline in ABT Site. Limitations Core function Plant view Based on the user role of the currently logged in user Only displays graphic components and data points to which the user account has at least Read access.
Graphics engineering with Graphics Builder Using the Builder pane tools Limitations Core function Based on the user role of the currently logged in user Based on the model of Desigo Control Point device Additional limitations when working offline in ABT Site The model of Desigo Control Point device determines availability. Trend export Not supported on PXM… devices. However, trend data can be exported if you connect to a PXM… device from a browser on a computer.
Graphics engineering with Graphics Builder Using the Builder pane tools 3.2.1.1 BASIC PROPERTIES Use the BASIC PROPERTIES to modify the graphic name or change the appearance of the selected component. General properties ● Name field (not labeled) The name of the currently-selected graphic component. To rename a graphic, click on an open area of the graphic background until the current graphic name displays in the Name field. Enter a new name for the graphic and click SAVE .
Graphics engineering with Graphics Builder Using the Builder pane tools BORDER To add a border to the selected component, enter a point value in the WIDTH field and select a line TYPE from the drop-down list. Use the default setting to change All borders sections of the border, use the Side at once. To change individual , Top-bottom or Corner border settings. ● To change the border color, click the COLOR field to open the palette. Select a color and click the COLOR field again to save your selection.
Graphics engineering with Graphics Builder Using the Builder pane tools 3.2.1.2 ADVANCED PROPERTIES Use the ADVANCED PROPERTIES section to add, edit and remove tags for the selected component. ① binding property The binding property is a string tag that displays binding information for the selected component. Data point binding [➙ 55] ② ● For components with absolute binding, the ID for a specific data point in the database is displayed. For example, id == @20a3572b-28b7e002.
Graphics engineering with Graphics Builder Using the Builder pane tools Table 11: COMPONENTS. Indicator Name Description AM chart This component is only available on devices that support the dashboard feature. A solution for creating charts. For example, column, bar, line, area, pie, funnel, XY and bubble. For more information, see www.amcharts.com/resources/. Pie charts use the program pie chart program, which is in the Public dashboard sample graphic.
Graphics engineering with Graphics Builder Using the Builder pane tools CAUTION Minimize links to external URLs. Linking to external URLs, such as Favorites, Web cams and external Web services poses a security risk. ● ● URLs shall only direct to secure services, such as Web servers hosted by devices in the building automation control network.
Graphics engineering with Graphics Builder Using the Builder pane tools Indicator 3.2.3 Name Description Text area An HTML text box that accepts user input for a program. Video A component to view videos from the graphics database. LAYERS pane The LAYERS pane displays a hierarchical structure for all the components in a graphic. Components at the top of the list are in the top layer of the graphic. Components lower in the list are in lower layers of the graphic.
Graphics engineering with Graphics Builder Using the Builder pane tools ● ● ● Sample dashboard public Sample RoomOperator Landscape end-user room graphic Sample RoomOperator Portrait end-user room graphic When a graphic with multiple layers is opened in Graphics Builder, you may need to use Show/hide to display the layer to edit. For example, the Sample dashboard public graphic contains three dashboard layers—Weather, Energy and Water. The Weather layer is the default view.
Graphics engineering with Graphics Builder Using the Builder pane tools Figure 4: Moving an element to a different layer. 3.2.4 VIRTUAL POINTS pane The VIRTUAL POINTS pane displays the data points that belong to the graphic. A virtual point is created for every data point used in the graphic. Each virtual point has a binding property that displays the ID or query that fetches information from a data point at runtime. A single virtual point can be associated with many graphic components.
Graphics engineering with Graphics Builder Using the Builder pane tools 3.2.4.2 Binding data points to a graphic component To bind data points to a graphic component, drag-and-drop the data point from the VIRTUAL POINTS pane onto the graphic component. Figure 6: Binding a data point to a graphic component. 3.2.4.3 Renaming a virtual point To rename the virtual point within the graphic, modify the text in the Name field. This only changes the virtual point name in the current graphic.
Graphics engineering with Graphics Builder Using the Builder pane tools Figure 7: Nested structure in the VIRTUAL POINTS pane. Using REFORMAT NAME 1. From the EQUIPMENTS pane, drag-and-drop a data point onto the graphic. A virtual point is automatically created. 2. In the VIRTUAL POINTS pane, right-click on the new data point and select TOOLS > REFORMAT NAME. The virtual point is automatically renamed based on its location in the application hierarchy.
Graphics engineering with Graphics Builder Using the Builder pane tools 3. Select the remaining virtual point and click Minus to delete it. The nested structure is deleted. 4. Re-add the data points and select TOOLS > REFORMAT NAME after adding each data point.
Graphics engineering with Graphics Builder Using the Builder pane tools 3.2.4.4 Adding a new tag or property tag 1. Click for the data point and select ADD PROPERTY. 2. If necessary, change the property type. ADVANCED PROPERTIES [➙ 64] 3. Name the tag.
Graphics engineering with Graphics Builder Graphics libraries 3.2.5 EQUIPMENTS pane The EQUIPMENTS pane allows you to select objects from your building structure that represent a value, setpoint or status. To automatically create a Smart label with an absolute binding, drag-and-drop an object onto the graphic. Data point binding [➙ 55] Figure 8: EQUIPMENTS pane. 3.
Graphics engineering with Graphics Builder Graphics libraries Figure 9: Example of a supersample AHU graphic. Pre-loaded supersample graphics library The following tables outline the supersample graphics that are currently pre-loaded in the Desigo Control Point device. Note Primary supersamples can only be used as graphic templates. Automatic connection of data points to graphic elements is not supported. Table 14: Primary supersamples.
Graphics engineering with Graphics Builder Graphics libraries Supersample graphic name Look Description Sample HGRP_1GRP 2D+ / 2D Heat generation: one group Sample HGRP_1GrpPu 2D+ / 2D Heat generation: one group with mixing circuit Sample Heating Curve – Calculates the flow temperature setpoint based on outside air temperature, room setpoint and other factors, such as wind and solar. Table 15: Room and Room segment supersamples.
Graphics engineering with Graphics Builder Graphics libraries Using the end-user room graphic templates The following figures show examples of the Sample RoomOperator Landscape and Sample RoomOperator Portrait templates for end-user room devices. ① Top navigation bar Contains the Siemens logo, the roomNameDisplay object and the tempDisplay object. ② Control display Select Siemens QMX widgets from the COMPONENTS pane to create an end-user room display on a touch panel.
Graphics engineering with Graphics Builder Graphics libraries Adding the Light, SmartLabel and StatusIndicator models to a graphic 1. Drag-and-drop the Light, SmartLabel or StatusIndicator model into the graphic. 2. Find the corresponding command point in the EQUIPMENTS pane and drag- and-drop it onto the model. 3. (Optional) Select the model, right-click and select TOOLS > RELATIVIZE. Select a location in the building structure to create the relative reference and click Apply. 4.
Graphics engineering with Graphics Builder Graphics libraries Table 17: Standard components. Category Description Components Dashboard components. HTML components HTML components for an interactive display. Central plant 2D Valves, chillers, pumps, boilers, cooling towers and pipes. Central plant sensors, 2D Flow, pressure and temperature sensors and a generic VFD. Coils, 3D Cooling and heating coils, including brand-specific images.
Graphics engineering with Graphics Builder Workflows 3.4 Workflows 3.4.1 Using a supersample graphic to create a graphic with relative binding for your system NOTE: the instructions given in this section apply only to room Automation supersample graphics. Supersample graphics may be used without modification to view the status of your system. However, each time a graphic is displayed, the application takes additional time to determine which components are not used and then hide them from the display.
Graphics engineering with Graphics Builder Workflows 5. Delete the components and smart labels that do not apply to your system. 6. Do the following to remove virtual points that were only used for objects that have been deleted: a. Click in the panels menu and select the VIRTUAL POINTS pane. b. Right-click on the list of virtual points and select CLEAN. c. Click REMOVE to remove the unused virtual points. Adding graphic components: 1. Drag-and-drop graphic components from the COMPONENTS pane.
Graphics engineering with Graphics Builder Workflows Verifying the binding for the objects you added: 1. To verify that the objects you added have relative bindings, select the graphic component or smart label, right-click and select TOOLS > VIEW BINDINGS. Data point binding [➙ 55] If an object has a relative binding, the binding query is displayed. For example, equipRef==$id and (point or shadowPoint) and cmd and position and vavDischarge.
Graphics engineering with Graphics Builder Workflows 3.4.2 Creating graphics for touch panels This topic provides general tips for creating graphics being displayed on a touch panel. ● To optimize graphic display time on touch panels, use a graphic resolution of 1157 × 664 so that resizing is not required at runtime.
Graphics engineering with Graphics Builder Working with dashboards 4. Click Apply. 5. Click SAVE and close the graphic. 3.5 Working with dashboards Dashboards are a specific application of graphics that display trend data and present values in elements, such as bar charts, pie charts and gauges. Dashboards only display information—they do not contain elements for commanding objects.
Graphics engineering with Graphics Builder Working with dashboards 3.5.1 The Facility manager dashboard user interface The Sample dashboard facility manager graphic provides a facility manager with detailed information regarding the energy consumption of a building. ① Energy and maximum power demand (bar and line chart) Created with the AM chart component. ⓐ Electrical energy generation and consumption. ⓑ 15-minute average maximum power demand for the selected reporting interval ⓓ.
Graphics engineering with Graphics Builder Working with dashboards 3.5.1.1 Configuring the Facility manager dashboard This topic outlines the workflow to configure the Facility manager dashboard so that it displays data from your system. Modifying the chart types or default settings of the Facility manager dashboard are advanced tasks that require a good understanding of graphic programs and commonlyused open source tools, such as Haystack and Java.
Graphics engineering with Graphics Builder Working with dashboards 3. Click Next. 4. Select the desired settings in the Trend data collection settings dialog box. 5. Click Apply to save the trend definition. For more information on adding a trend definition, see the Trends tools section of the Desigo Control Point Operation Manual (A6V11211557). BT Download Center ⓑ Adding trended data points to the bar and line chart 1.
Graphics engineering with Graphics Builder Working with dashboards ⓒ Displaying the Daily Max Power line This procedure displays the 15-minute average maximum power demand line on the chart. 1. In the VIRTUAL POINTS pane, click for the energy consumption data point and then select ADD PROPERTY. 2. Scroll down to find the new property, change its name to forMaxPower and click . 3. Click the STRING icon and change the property to BOOLEAN 4. Set the toggle switch to true (ON) and click 5.
Graphics engineering with Graphics Builder Working with dashboards ③ Setting up energy consumption of selected subsystems (pie chart) The pie chart displays a summary of energy consumption for multiple data points. 1. In the EQUIPMENTS value points pane, press CTRL and click to select all the Present that supply data for the chart. Note: All the data points must be assigned together. They cannot be added oneby-one. A star displays to indicate that a data point is selected. 2.
Graphics engineering with Graphics Builder Working with dashboards 3.5.2 The Public dashboard user interface The Sample dashboard public graphic is designed for use in public spaces to share information about a building. This graphic contains three dashboard layers—Weather, Energy and Water—and a navigation bar at the top to navigate between the layers. The Weather layer is the default view. ① Navigation bar (MainLayer) Contains the date and time display, the tabbed buttons and the company logo.
Graphics engineering with Graphics Builder Working with dashboards 3.5.2.1 Displaying the Energy and Water layers for editing The Sample dashboard public graphic contains three dashboard layers and a navigation bar at the top to navigate between the layers. When this graphic is opened in Graphics Builder, you may need to use Show/hide to display the layer to edit. The Weather layer is the default view. To display the Energy or Water layer for editing, do the following: 1.
Graphics engineering with Graphics Builder Working with dashboards ② Changing the location displayed in the Weather layer This procedure replaces the existing HTML code for the Ractive component in the Weather layer. The default settings for the Weather layer are as follows: ● ● ● ● Location: Chicago, United States of America. Number of days: Four Temperature unit: Fahrenheit Wind speed unit: mph 1. Go to https://www.meteoblue.com/en/weather.
Graphics engineering with Graphics Builder Working with dashboards 4. Select the desired settings in the Trend data collection settings dialog box. 5. Click Apply to save the trend definition. For more information on adding a trend definition, see the Trends tools section of the Desigo Control Point Operation Manual (A6V11211557). BT Download Center ⓑ Adding a trended data point to the Energy and Water layers 1. In the LAYERS pane, click to display the layer to edit.
Graphics engineering with Graphics Builder Working with dashboards Figure 10: Elements of the Ractive components that display resource consumption. ① The Ractive component ② fillColor The color of the icon. You can use any of the 140 valid CSS color strings supported by modern browsers. In this case, it’s red. numIcons The number of icons displayed. In this case, it’s 10.
Graphics engineering with Graphics Builder Working with dashboards ⑥ units Free-form text describing the unit of measure. ⑦ cycleText Free-form text describing the common household device used for comparison. ⑧ maxValue Maximum daily consumption used in the comparison calculation. Note: Do not edit this value. It is overwritten once the graphic displays live data. ⑨ minValue Minimum daily consumption used in the comparison calculation. Note: Do not edit this value.
Graphics engineering with Graphics Builder Working with dashboards 6. Edit the properties as desired. For more information, see the figure Elements of the Ractive components that display resource consumption at the beginning of this topic. 7. When you’re done editing, click Show/hide to return the Weather layer to the default view. 8. Click and Save to save the graphic. The icons and comparison descriptions have been updated. 3.5.2.
Graphics engineering with Graphics Builder Working with dashboards 6. Name the new tag mode and click . 7. Select the value for the mode tag (initially named NewValue), change it to the name of the tab and click . A new layer has been added to the dashboard. Adding a button to the navigation bar 1. From the COMPONENTS Button Siemens Building Technologies > HTML COMPONENTS pane, drag-and-drop the onto the MainLayer in the LAYERS pane.
Graphics engineering with Graphics Builder Working with dashboards 2. Drag the Button to the desired position in the MainLayer hierarchy. For example, between the Energy and Weather layers. 3. In the BASIC PROPERTIES pane, do the following to make the new button match the existing dashboard design: a. Select an existing button and copy the Classes value. b. Paste the value into the Classes field of the new button.
Graphics engineering with Graphics Builder Working with dashboards b. Name the new MARKER c. Click tag button and click to add a new string tag d. Name the new string tag . . mode and click . e. Select the value for the mode tag (initially named NewValue) and enter the name of the dashboard tab that the button points to. f. Click . 5. When you’re done editing, click Show/hide to return the Weather layer to the default view. 6. Click and Save to save the graphic.
Graphics engineering with Graphics Builder Working with dashboards 5. To edit the Label text, scroll to the Text field at the bottom of the BASIC PROPERTIES pane. 6. To modify the appearance of the text, expand the Font section. 7. If desired, use the other BASIC PROPERTIES to modify the appearance of the Label. PROPERTIES pane [➙ 61] 8. When you’re done editing, click Show/hide to return the Weather layer to the default view. 9. Click and Save to save the graphic.
Graphics engineering with Graphics Builder Working with dashboards 3.5.4 Adding or replacing a background image This procedure adds a new image or replaces the existing background image for a tab. Each tab of the dashboard can have a unique background image. 1. Open the Public dashboard graphic for editing and display the PROPERTIES and LAYERS views. 2. Click Show/hide to display the layer to edit. For example, hide the Weather layer and display the Energy layer. 3. Expand the layer you are editing.
Graphics engineering with Graphics Builder Working with dashboards 9. In the BASIC PROPERTIES , click Lock 10. When you’re done editing, click Show/hide to lock the background layer. to return the Weather layer to the default view. 11. Click and Save to save the graphic. The new background image now displays in the dashboard. 3.5.
Graphics engineering with Graphics Builder Working with dashboards 5. When you’re done editing, click Show/hide to return the Weather layer to the default view. 6. Click and Save to save the graphic. The “common household devices” now display in the dashboard for the Energy tab. 3.5.5.1 Changing the refresh interval for a trended data point Changing the refresh interval By default, data linked to the Energy and Water layers of the Public dashboard is refreshed every three hours.
Graphics engineering with Graphics Builder Working with dashboards 4. Change the Delay field to the desired refresh interval. 5. When you’re done editing, click Show/hide to return the Weather layer to the default view. 6. Click and Save to save the graphic. The refresh interval for the trend data has been updated.
Graphics engineering with Graphics Builder Working with dashboards 3.5.6 Adding external media to a dashboard External media, such as a YouTube video, can be embedded in a dashboard by using an HTML inline frame (