
User Manual


Operating Step
-
by
-
Step
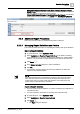
Reports
2
A6V10415471_en_a_40 85 | 352
14. Save the Excel document.
a The saved Excel document is a template that contains the PivotTable.
15. Select the report definition you created.
16. From the Extended Operation tab, specify the path of the template in the Excel
Output Template field and click Set. By default, the Excel Output Template field
does not display in the Extended Operation tab. In order to display this field,
you must select the DL3 display level check box for the Template Path property
in the report definition Object Model.
NOTE: The template path is the path of the Server machine. A Process Monitor
User must have access to the folder in which the template file is present for the
PivotTable to display.
17. Run the report.
a The generated report displays in the Run mode.
18. Click Create and view Excel .
19. Click Open.
a The Excel document displays. The first worksheet displays information on the
PivotTable and the details of other tables in the Report display in the other
sheets.
2.5.3.2 Configuring Report Parameters
You can customize your report definition by performing the following activities:
● Adding elements such as tables, plots, keywords, and so on.
● Configuring the layout of the report by setting the orientation, page size,
margins, headers and footers.
● Formatting the report elements for an enhanced appearance by applying color,
adjusting positions of the elements, and so on.
Insert Tables
w You have selected an existing report definition in System Browser > Reports or
you have created a report definition and now want to configure it.
1. Click the Home tab.
2. Perform either of the steps to insert a table. Ensure that you are not inserting
the table in the header/footer section of the report definition:
– From the Insert group box on the Home tab, click the Table group box,
select a table, such as Objects, Active Events or Activities, and drag-and-
drop it in the report definition.
The cursor shape changes and indicates the selected table name.
– Right-click the report definition and from the Insert Table option, select the
table type.
– Drag-and-drop the desired system object from System Browser onto the
report definition. The Name filter of the inserted table is set to the dropped
system object.
a The table is added to the report definition with its default columns.
3. Right-click the table and select Select Columns to add new columns or remove
displayed columns.
a The Select Columns dialog box displays. The layout and content of this
dialog box varies according to the type of table selected.
4. Select the check box preceding each column to add it to the table. In case of a
property, you must first expand it, and then check the columns.
NOTE: For an Objects table: Select the object related to the Objects table from