
User Manual


Operating Reference
Trends
3
A6V10415471_en_a_40 301 | 352
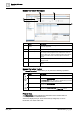
Data Point Key
Column Description
Series source. Indicates if the displayed data is recorded by the management station
data (online ) or a field device (offline ).
Trended
Object
Displays the object names for the Trendlog object.
Trended
Property
Displays the trended property name for the object.
Alias Displays the alias name for the object.
Unit Physical unit for the data point.
Value Displays the last displayed current value (unless the time bar is in use. In this case,
the value is displayed at the intersection).
Time Displays the time for the most recent value (unless the time bar is used; in this case,
the value is displayed at the intersection).
Date Displays the date for the most recent value (unless the time bar is used; in this case,
the value is displayed at the intersection).
Reduced
When this symbol displays, not all values for this series are displayed in the Trend
View (dependent on the displayed time period).
Y-axis Indicates the Y-axis where the point is scaled.
Remove Removes the selected trend value from the Trend View.
Show/hide Temporarily shows/hides the trend curve in the Trend View.
System Name Displays the system name of the trended object. The system name enables you to
identify the origin of the trended objects in a distributed environment.
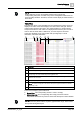
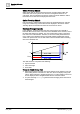
Reduced Display :
Displays a maximum of two values per interval. The interval is calculated based on
the set sample rate for the Trend View (Trend Chart Properties).
● 1 interval = Max. displayed samples per series/2.
– Example 1: 100/2 = 50 intervals
– Example 2: 400/2 = 200 intervals
A reduced display can also occur with just a few values, for example, when the
values are recorded within a short interval. With the reduced display, minimum and
maximum values always display.