
User Manual

Operating Reference
Trends
3
A6V10415471_en_a_40 297 | 352
NOTE:
Automatic/manual scaling properties act on both main and comparative view.
Automatic scaling is temporarily disabled when switching to Zoom mode.
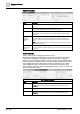
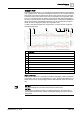
Legend Properties
Menu Description
Legend The position can be left, right, above, or below the Trend View. Under a
comparison view, the legend always displays on the right.
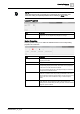
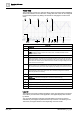
Series Properties
Series properties allow you to define the individual series for the corresponding
properties in Trend View.
Menu Description
Line Properties Defines the appropriate property type, form and color, as well as the
property for the series.
Visible Displays the trend curve if this check box is selected.
Show Markers Defines the corresponding property type, and size, as well as the
corresponding property for the series. The markers are only displayed
in the trend curve if this check box is selected.
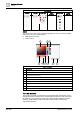
The X-axis is always the time axis. The diagram display is calculated to
correspond to the selected time line.
Show Values Displays numerically each measured value for the read value if this
check box is selected. Values may overlap (unreadable) in the Trend
View for intensive measured recorded values or a time range that is too
large. In this case, select a smaller time range or switch to display
values.
Show Quality Icons The Trend View can display a number of state attributes, referred to as
quality attributes, along with the trend data. These enable you to
identify problems with the data point being recorded, and assist with the
diagnosis of plant conditions.