
User Manual


Operating Reference
Reports
3
260 | 352 A6V10415471_en_a_40
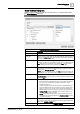
Clear All Unchecks all columns except mandatory columns. The Selected Columns
list displays only mandatory columns.
Move Up
Moves the selected column one step up in the Selected Columns list. The
Move Up button is unavailable if you select the column on the top.
Move Down
Moves the selected column one step down in the Selected Columns list. The
Move Down button is unavailable if you select the column at bottom.
Remove
Removes the selected column from the Selected Columns list.
Sorting Data in Tables
Sorting allows you to arrange data in a table in the ascending or descending order.
Sorting priority depends on the order in which the column headers are clicked. You
can sort the table columns in Edit mode as well as in Run mode. If you sort the
table columns in Edit mode, then the sorted data displays in Run mode according
to the sort criteria specified in Edit mode. When sorting is applied on an executed
report, data in the current snapshot is sorted.
In Activities, Events and Event Details tables, you cannot sort columns such as
type, sub-type, discipline, object name, object description or object location. In
Trends tables, you can only sort the Date column. By default, whenever you insert
a Trends table there is an ascending sort on the Date column.
NOTE:
You cannot perform sorting during report execution. You can continue sorting
after report execution is complete or is stopped.
Plot Group Box
A plot displays data in a graphical view. The Plot group box contains different
graphic elements from different data sources such as Trends and Graphics.
Graphics Plot
You can drag-and-drop any graphics definition or manual view port from System
Browser onto a Report Definition to insert a graphics plot. This inserts a
placeholder graphics plot and sets the Name filter to the dragged and dropped
object.
When you execute a report containing a graphics plot, it displays the graphic image
associated with the dragged and dropped object. If the object is not present in any
of the graphics definitions, then an error message displays in the report
management section.
Values are displayed as per value scaled units (if configured). For more
information, see Value Scale Units.
Trends Plot
You can drag-and-drop a Trend View Definition from System Browser onto a
Report Definition to insert a trends plot. The system behaves the same way as
when inserting a graphics plot. For more information on the Trends Plot and its
configuration, see Configuring a Trends Plot [➙ 111].
Values are displayed as per value scaled units (if configured). For more
information, see Value Scale Units.
Textgroup Box
Displays a label that you can add to a Report Definition. You can insert labels
(Blank, Page, and Report) in the header/footer section or anywhere in the Report
Definition.
Using labels, you can type text to be displayed in the Report Definition or insert
keywords. By default the labels display all the languages configured in the system.