
User Manual

Op
erating Reference
Reports
3
A6V10415471_en_a_40 245 | 352
Observer Identifier (Internal)
Alias [Object]
Alias [Observer]
Unit
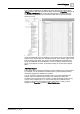
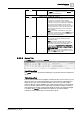
● When you add a Condition filter to the Event Details table, you cannot apply the
OR operator between two filter expressions set on two different columns.
● You can apply the OR operator between two filter expressions set on the same
column. To apply the OR operator on the same column, select the column and
the operator, press SHIFT or CTRL, depending on whether you want to select
values listed next to each other or away from each other and then click Add.
● You cannot apply the NOT operator in the Condition filter for an Events table.
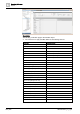
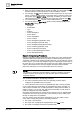
Trends Plot
The Trends plot provides a graphical representation of the change of value of an
object over a period of time.
In order to view the change of value graphically, you must assign a Trend View
Definition as a Name filter to the Plot. You cannot add a Condition filter to the
Trends Plot.
For example, you can create a Trends Plot if you want to track the change of value
of an Analog Input object graphically over a period of 10 hours.
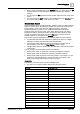
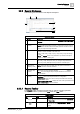
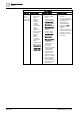
All Logs Report
The All Logs table provides information on system activities and events.
Constraints
The following constraints apply to the All Logs report.
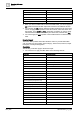
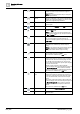
● You cannot apply sorting on the following columns:
No Sorting
Discipline
Subdiscipline
Type
Subtype
Source Description
Source Name
Source Designation
Source Location
Source Designation [Application View]
Source Designation [Current View]
Source Designation [Management View]
Source Location [Application View]
Source Location [Current View]
Source Location [Management View]
Source Identifier [Internal]
Property
Quality
Previous Quality
Alias [Observer]
Alias [Source]