
User Manual

Operating Step
-
by
-
Ste
p
Trends
2
128 | 352 A6V10415471_en_a_40
Use Mouse Zoom
The zoom function allows you to select a time range in the currently selected Trend
View (applies as well for the comparison view) by zooming in on the X-axis and Y-
axis.
w You are in an active Trend View and in the Stop mode.
1. Click Zoom .
2. Navigate to the left zoom starting range.
a The point changes shape and the tooltip displays the current position.
3. Drag the pointer to the right zoom end range.
a The selected zoom range displays in the Trend View.
4. Click Zoom .
a The original time range, prior to the zoom in, displays, even if you zoom
multiple times.
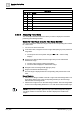
Select Table View
1. Click Stop .
a The automatic data update is stopped.
2. Click table view
a The table opens in default view. Click the time stamp header to sort the
rows by ascending or descending order.
3. Click to show or hide interpolated values.
a Interpolated values are displayed in light-grey.
4. Click table view again .
a The graphical Trend View re-displays.
5. Click Run to start the automatic data update.
NOTE: The priority displays in the table if a subsystem supports information on
BACnet write priority (1-16).
Highlight Data Series Temporarily
During analysis, it is helpful to temporarily bring a certain series in the Trend View
to improve the readability of the trend curve.
w Multiple trend curves display in the Trend View.
1. Drag the pointer to the trend curve you want to bring forth.
a All non-selected trend curves are reduced in their display intensity.
a The measured value, as well as time and date, are displayed in tooltip at
the pointer position.
a The quality attribute is brought forwards only when one trend curve is
visible.
2. Drag the pointer to once again view all trend curves.
Hide Data Series Temporarily
w Multiple trend curves display in the Trend View.
1. Click Properties .
a The menu bar displays.
2. Select the series you want to hide in Legend.
3. Click Series Properties.