
User Manual

Operating Step
-
by
-
Ste
p
Trends
2
120 | 352 A6V10415471_en_a_40
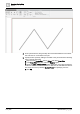
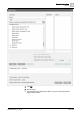
5. Click Save .
a The current measured values are updated in the chart each time the
measured value of a data point changes.
6. Click Stop .
a The measured values display on the Trend View.
NOTE:
Measured values display on top of one another when the changes to the
measured values occur in quick succession or the selected time range is too
large. Since the measured values are no longer readable, select a smaller time
range or switch off the labels.
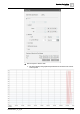
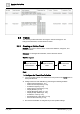
Display Quality Attributes
You want to display the quality attribute for the data point at the time of the
measured value .
1. Select the series for editing from the legend for the Trend View.
2. Click Properties .
3. Click the Series Properties tab.
4. Select the Show quality icons check box.
5. Click Save .
6. Click Stop .
a Interventions or states that are not normal display with the corresponding
quality attribute, for example, (see Quality Attributes).
NOTE:
The quality attributes are hidden when you re-click Run and the trend series is
updated. You must select Advanced display if chart stopped in the Chart
Properties tab (acts on all series) if you want to display quality attributes during
update. If there are too many symbols, the update to the Trend View can take
some time.
With the reduced display , not all quality attributes can display. In order to
display all quality attributes, limit the time period.
Position the Y-Axis
1. Select the series for editing from the legend for the Trend View.
2. Click Properties .
3. Click the Series Properties tab.