
User Manual

Operating Step
-
by
-
Step
Trends
2
A6V10415471_en_a_40 119 | 352
NOTE:
Do not select a thick line if you want to display the Trend curve with a marker. The
marker will disappear behind a thick line.
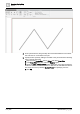
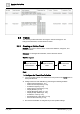
Display Markers
Markers allow you to further emphasize the measurement time using a symbol
.
w The Show quality icons property must be selected.
1. Select the series for editing from the legend for the Trend View.
2. Click Properties .
3. Click the Series Properties tab.
4. Select the Show markers check box.
– Select the corresponding type from the Marker style drop-
down list.
– Select the appropriate size from the Marker size drop-down list.
5. Click Save .
a The edited properties are saved to the Trend database.
6. Click Stop .
a The markers display on the trend view.
NOTE:
Be careful not to select too thick a line if you want to display markers. The marker
disappears behind a thick line. You can see the markers only when you stop the
trend view.
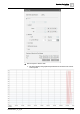
Display Measured Values
You want to display the measured value for the data point. Measured values
display only when you stop the Trend View.
w The Show quality icons property must be selected.
1. Select the series for editing from the legend for the Trend View.
2. Click Properties .
3. Click the Series Properties tab.
4. Select the Show Values check box.