
User Manual

Operating Step
-
by
-
Step
Trends
2
116 | 352 A6V10415471_en_a_40
2.6 Trends
This section provides instructions for using the Trends of Desigo CC. For
background information, see the reference section.
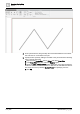
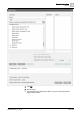
2.6.1 Creating an Online Trend
Scenario: You want to view the data in a trend view definition, configure it, and
print the contents.
Reference: For background information, see the reference section.
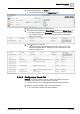
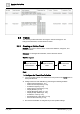
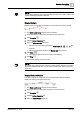
Workflow diagram:
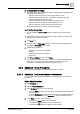
Steps:
1 – Configure the Trend View Definition
w You have created a trend view definition and it is present in the Trends folder in
the System Browser.
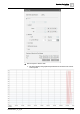
l Configure the trend view definition by performing the following activities:
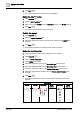
– Define Chart Properties [➙ 117]
– Define the Axis Properties [➙ 118]
– Position the legend [➙ 118]
– Define the Line Properties [➙ 118]
– Display Markers [➙ 119]
– Display Measured Values [➙ 119]
– Display Quality Attributes [➙ 120]
– Position the Y-Axis [➙ 120]
– Edit background or line colors [➙ 121]
– Show or Hide Columns [➙ 121]
a The trend view definition is configured as per the specified settings.
Configure the Trend
View Definition
Analyze the Trend
Data
1 2
Print the Trend
View
3