
User Manual

Operating Step
-
by
-
Step
Rep
orts
2
112 | 352 A6V10415471_en_a_40
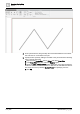
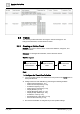
2. From System Browser, drag-and-drop the Trend View Definition to the Trends
Plot. This acts as a name filter to the plot.
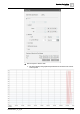
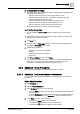
3. Specify the time period by adding a Time filter to the plot. Perform the following
steps to add the Time filter:
a. Right-click the Trends Plot, point to Filters and select Time Filter.
b. In the Time Filter dialog box, select the Relative option.
c. Select the Last or Current Period option, depending on the data requirement
for the last 10 hours or current 10 hours. In this case, we will obtain the data for
the current 10 hours by selecting Current Period and specifying 10 hours.
d. Click OK.