
User Manual

Getting Started
User Interface Basics
1
A6V10415471_en_a_40 11 | 352
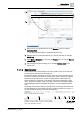
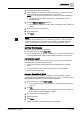
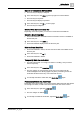
1. Select a view (1) in System Browser, in the Selection pane, for example
Application View.
a The selected view displays in the System Browser tree.
2. Navigate the tree to select the object (2) you want to work with, for example
Activity Log.
3. Select Manual Navigation (3), to freeze the Primary pane, for example Reports
> Activity Log.
4. Drag and drop the selected object (4), for example Address Book, to the
reports area.
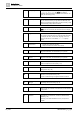
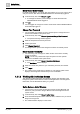
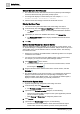
1.1.1.2 Summary Bar
The Summary bar is located along the top of the system screen, and is the main
point of entry to all the functions of Desigo CC.
By default, it displays collapsed to a slim bar, and it has a series of indicators that
provide an overview of the alarms and events in the system, grouped by category
followed by the operator menu, a system integrity indicator, and the filter icon.
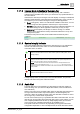
When the slim bar is expanded, on the left, the Summary bar displays the event
lamps, grouped by category, while on the right, it has buttons for starting multiple
System Manager windows, opening/closing Event List, and controlling the audio
alert.
Depending on the profile it displays a specific set of event lamps, the Event Detail
bar that highlights the most critical event in the system and allows you to open or
close the Event List window and control the audio alert.
Figure 1: Collapsed (Slim) Summary Bar
Figure 2: Expanded Summary Bar
2
1
3
4
1 2 3 4 5 6 7
9 10 1211 13
8