Desigo™ CC User Guide Version 4.
Copyright Notice Copyright Notice Notice Document information is subject to change without notice by Siemens Switzerland Ltd. Companies, names, and various data used in examples are fictitious unless otherwise noted. No part of this document may be reproduced or transmitted in any form or by any means, electronic or mechanical, for any purpose, without the express written permission of Siemens Switzerland Ltd.
Table of Contents 1 1.1 1.2 2 2.1 2.2 2.3 2.4 2.5 2.6 2.7 A6V10415471_en_a_40 Getting Started ..................................................................................... 7 User Interface Basics.................................................................................. 7 1.1.1 Standard UI Client........................................................................ 7 Basic Procedures.......................................................................................16 1.2.
2.7.2 Configuring and Printing Detailed Log ....................................... 141 2.7.3 Additional Log Viewer Procedures............................................. 143 2.8 Address Book .......................................................................................... 158 2.9 Remote Notifications................................................................................ 160 2.10 Logics......................................................................................................
3.7 3.8 3.9 3.6.5 Predicted Trends.......................................................................309 3.6.6 Trend Data Storage ..................................................................309 Log Viewer ..............................................................................................311 3.7.1 Overview of Log Viewer ............................................................311 3.7.2 Log Viewer Workspace .............................................................
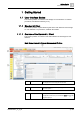
Getting Started 1 User Interface Basics 1 Getting Started 1.1 User Interface Basics This section provides an overview of the Desigo CC user interface. For related procedures, see Basic Procedures [➙ 16]. 1.1.1 Standard UI Client This section provides a quick reference guide to the main elements of the Desigo CC user interface. For procedures, see Basic Procedures. 1.1.1.1 Overview of the Standard UI Client This section provides an overview of the main elements of the Desigo CC user interface.
1 Getting Started User Interface Basics 4 Work area Large central portion of the screen below the Summary bar. The window displayed here will vary depending on the system function that is being used. It will typically contain the Event List or System Manager window. It can also display the Investigative or Assisted Treatment windows, the system help, and external documents or applications.
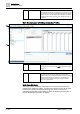
Getting Started 1 User Interface Basics 1 2 3 4 5 1 Selection pane (vertically along the left). Also referred to as Navigation pane. 2 Primary pane (to the right of the Selection pane). 3 Secondary pane (opens when required, alongside the Primary pane). 4 Contextual pane (underneath the Primary and Secondary panes, divided into two parts). 5 Status bar (along the bottom of the window). This bar displays status/update messages (Ready, Default loaded successfully, and so on).
1 Getting Started User Interface Basics ● Click the icon to lock the window layout . When the layout is locked, clicking one of the layout icons will not have any effect; this means that you cannot change the current layout, and resize, expand, or collapse the panes of the window. ● Normally, the Secondary pane opens on demand, when you make a selection that requires it. When the Secondary pane opens, it takes up half the space that would otherwise be allotted to the Primary pane.
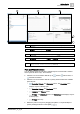
Getting Started 1 User Interface Basics 1 3 4 2 1. Select a view (1) in System Browser, in the Selection pane, for example Application View. a The selected view displays in the System Browser tree. 2. Navigate the tree to select the object (2) you want to work with, for example Activity Log. 3. Select Manual Navigation (3), to freeze the Primary pane, for example Reports > Activity Log. 4. Drag and drop the selected object (4), for example Address Book, to the reports area. 1.1.1.
1 Getting Started User Interface Basics 1 Company logo When you move your cursor on the logo, a tooltip tells you: Click to open the About Page. The About page displays information about the Desigo CC software. For instructions, see Display the About Page [➙ 20]. 2 Event lamps Summarizes the events in the system, grouped by categories . You can click an event lamp, to open Event List filtered by that category.
Getting Started 1 User Interface Basics 1.1.1.3 License Mode Indication in Summary Bar When the Desigo CC client application is running normally, with a valid and sufficient license available on the server, you will not see any special indication on the user interface. Otherwise, the Summary bar changes color and displays a message to indicate the following special situations, along with the time remaining (days, hours, minutes, or seconds) that you can continue running the Desigo CC client application.
1 Getting Started User Interface Basics the one for the most important (severe) event, irrespective of any filters or sorting you may have applied to Event List. For related procedures, see Temporarily Mute the Audio Alert [➙ 19] and Permanently Silence the Audio Alert [➙ 19]. Audio Alert Resound The audio alert ceases when the incoming events have been acknowledged and it will resume after 24 hours if a previously-acknowledged event has still not been fully processed (closed) by then.
Getting Started 1 User Interface Basics 1.1.1.7 Print See Print from the System Menu [➙ 20]. Active Tasks See Switch Between Active Windows [➙ 18]. Exit Ends your work session, and shut down the system. See End Your Work Session [➙ 17]. Logoff (Available in closed mode only.) Logs you off and automatically logs on the GMSDefaultUser. See Exit a Closed Mode Session [➙ 18].
1 Getting Started Basic Procedures 1.2 Basic Procedures This section contains procedures for getting started with Desigo CC. For background information, see User Interface Basics [➙ 7]. 1.2.1 Standard UI Client This section contains procedures for getting started with Desigo CC. For background information, see User Interface Basics. 1.2.1.1 Starting and Exiting the System This section provides instructions for starting and exiting Desigo CC.
Getting Started 1 Basic Procedures 1. Launch the Microsoft Internet Explorer. 2. In the address bar of the browser, enter the name of the computer where the Desigo CC Web Server resides (for example, //ITP0990c/). NOTE: If you do not have this information, contact your system administrator. a The Desigo CC page opens in the browser, and the Desigo CC tab contents display. 3. Click the Windows App Client thumbnail. a The installation of Desigo CC starts. When completed, the logon dialog box displays. 4.
1 Getting Started Basic Procedures Exit a Closed-Mode Session In closed-mode stations, you cannot shut down Desigo CC. You can only log off to end your session, after which the GMSDefaultUser is automatically logged on. 1. In the Summary bar, select Menu > Logoff. a A message box informs you that Desigo CC will be closed and the GMSDefaultUser will be logged on. 2. Click OK. a You are logged off. Desigo CC starts in closed mode and the GMSDefaultUser is automatically logged on.
Getting Started 1 Basic Procedures Expand or Collapse the Summary Bar w The Summary bar displays collapsed. 1. In the Summary bar, click down on the top right or an event indicator. a The Summary bar expands. w The Summary bar displays expanded. 1. In the Summary bar, click up on the top right. a The Summary bar collapses. Show or Hide the Event Detail Bar Depending on the client profile, you can show or hide the Event Detail bar.
1 Getting Started Basic Procedures Silence the Audio Alert Resound w The audio alert resumes after 24 hours because a previously-acknowledged event has still not been fully processed (closed) by then. w A message also displays on the Summary bar. For example, 24 hours Trouble resound: click here to silence. l Click the text of the message to silence the audio alert resound. Display the About Page w You want to view system information such as the Desigo CC version. 1.
Getting Started Basic Procedures – – – – 1 Adjust Margins (default is 50 pixels). Select the desired Orientation (default is Landscape). Select the Printer and Paper size. Adjust Scaling (default is Fit to page) and, if available, color option. 5. Click Print and Close. a The printout is sent to the selected printer.
2 Operating Step-by-Step System Manager 2 Operating Step-by-Step 2.1 System Manager This section provides instructions for using the main panes of the System Manager window. For background information, see the reference [➙ 171] section. 2.1.1 Working with System Manager This section provides instructions for System Manager common tasks. For background information, see Overview of System Manager [➙ 171]. Open System Manager w The System Manager window is not visible. 1.
Operating Step-by-Step 2 System Manager Change the Pane Layout of System Manager You can adjust or customize the arrangement of the panes in the System Manager window. 1. In the System Manager window header, if the lock pane layout icon is active (undimmed), click it so that it becomes dimmed. Otherwise the pane layout cannot be changed. 2. To switch between the available preset layouts, click the icons in the title bar: – : Selection, Primary, and Contextual panes.
2 Operating Step-by-Step System Manager Set How Objects are Labeled in System Manager You can define whether objects in System Manager are labeled with just a name, just a description, or both. For background information, see the reference [➙ 178] section. 1. In System Browser, click the Display Mode drop-down list. 2.
Operating Step-by-Step 2 System Manager Send a Selection to the Secondary Pane You can work with a system object in the Secondary pane so that the current contents of the Primary and Contextual panes will not be changed. 1. In the System Manager window header, check that the current pane layout includes the Secondary pane: or . 2. In the Primary pane header, check that the pushpin icon is in the unlocked position , so that opening of the Secondary pane is allowed. 3.
2 Operating Step-by-Step System Manager – Run a search by name/description and other criteria such as discipline, type, and so forth. See Searching for Objects [➙ 28]. 3. From the System Browser tree, or from the list of search results, select the objects as follows: – To select multiple non-contiguous objects, press and hold the CTRL key while clicking the objects. – To select multiple contiguous objects, press and hold the SHIFT key while clicking the first and the last object in the range.
Operating Step-by-Step 2 System Manager Revisit Recent Selections from the Navigation Bar The Navigation bar provides a browser-like history of recent selections so that you can easily revisit objects previously displayed in the Primary pane. For background information, see Navigation Bar [➙ 176]. 1. Click Open navigation bar in the System Manager header. 2. To jump to a specific, previously-visited selection: a. Click or press CTRL+H to view the selection history.
2 Operating Step-by-Step System Manager – Click the scroll icons (Newer) (Older) to move backward and forward among the recent views. a The selected view displays in the Primary pane, and a new recently visited view item is created and displays in Recently Viewed. 2.1.2 System Browser This section provides step-by-step instructions for System Browser tasks. For background information, see the reference [➙ 178] section. 2.1.2.1 Selecting Views 1. From the Views list box, click the drop-down arrow.
Operating Step-by-Step 2 System Manager 2.1.2.5 Choosing a Display Mode 1. In System Browser, click the Display Mode drop-down list. 2. Select the mode you want for displaying objects. a The object displays in the new mode throughout the various panes in System Manager. 2.1.2.6 Making a Manually Selected Object the New Primary Selection w The Manual Navigation box is checked, with one or more objects selected. l Do one of the following: – Right-click and select Send to the Primary Pane.
2 Operating Step-by-Step System Manager 4. (Optional) Click the icon to display detailed information about the selected data points. 5. Do one of the following: – – Change the value and click Send or Change. Click a command button to execute the respective function. a Only objects properties that have been changed will be logged in the Activity Log database. 2.1.3 Textual Viewer This section provides step-by-step instructions for Textual Viewer.
Operating Step-by-Step 2 System Manager l In Textual Viewer, double-click the object you want to make the new primary selection. a Textual Viewer sends the object to System Browser, and System Browser changes its focus to the object, just as if you had selected the object directly from System Browser. System Browser then refreshes the Textual Viewer, which displays the new primary selection. 2.1.3.3 Rearranging Columns w System Manager is in Operating mode.
2 Operating Step-by-Step System Manager 2.1.4.2 Commanding Properties for Multiple Objects w You want to simultaneously command properties for multiple objects of the same type. 1. In System Browser, navigate to the locations containing the objects you want to select, and then select them. 2. Click the Operation tab. 3. Click the triangular symbol in the lower-right-hand corner on the icon next to the property you want to command.
Operating Step-by-Step 2 Graphics Viewer 2.1.5.5 Ungrouping Items in the List w You have selected an object with Related Items displayed in Groups view. l From Related Items, click the Ungroup button. a All items are ungrouped. 2.1.5.6 Creating a New Object w You have selected an object with links displaying in Related Items. l From Related Items, click the type of object you would like to create—for example, New Report. a The management station opens a new object type in the Secondary pane. 2.
2 Operating Step-by-Step Graphics Viewer 1. From the Status and Commands window, navigate the property you want to command. If there are more than four properties displayed in the window, you may have to scroll to locate the property. a The system displays a list of the object’s properties, their current state, value, status, and all commands available to you for this object, based on your system privileges and the configuration settings for the object. 2.
Operating Step-by-Step Graphics Viewer 2 4. (Optional) Select the Discipline radial button, and from the drop-down menu select a discipline, or select to view all layers. a The graphic updates and only displays the layers associated with the selected discipline. a The list of layers in the Navigation View is grayed-out, and only the layers associated with the selected depth are check-marked. 5.
2 Operating Step-by-Step Graphics Viewer 1. In System Browser, select Application View. 2. Select Applications > Graphics > [graphic object]. a Graphics Viewer displays the graphic object. Select Objects within Graphics Viewer w You have a graphic open, and you would like to view the properties of an object on the graphic. w System Manager is in Operating mode. 1. In System Browser, select Application View. 2. Select Applications > Graphics > [graphic]. 3. Click the object.
Operating Step-by-Step 2 Graphics Viewer 2.2.5 Zooming in the Graphics Viewer Select the topic related to your task: Center and Zoom with the Aerial View w You have a graphic open and would like to display the Aerial View. w System Manager is in Operating mode. 1. In System Browser, select Application View. 2. Select Applications > Graphics > [graphic]. 3. Click Aerial View . a The Aerial View displays. 4. Do one of the following: – – Click a specific area to adjust the view.
2 Operating Step-by-Step Graphics Viewer 1. Right-click the object, and select Status and Commands. a The system displays a list of the object’s properties, their current state, value, status, and all commands available to you for this object, based on your system privileges and the configuration settings for the object. a If you select multiple properties to command, the selected properties display an icon with a triangular Symbol in the lower right-hand corner. 2.
Operating Step-by-Step Graphics Viewer 2 3. Click Delete . a A confirmation message displays. 4. Click Yes. a The graphic item is deleted. Edit a Graphic NOTICE NOTE: In order to complete this procedure, you must have the appropriate access rights to for the Graphics Editor. w System Manager is in Operating mode. 1. In System Browser, select Application View. 2. Select Applications > Graphics > [graphic]. 3. Click Edit . a The Graphics Editor displays. 4. Make modifications to the graphic.. 5.
2 Operating Step-by-Step Alarms 2.3 Alarms This section provides instructions for common tasks related to event handling in Desigo CC. For background information, see the reference section. 2.3.1 Handling Events from Event List The Event List window is your main starting point for dealing with events. From here you can get information about an event or its source, directly send eventhandling commands, and initiate investigative or assisted treatment.
Operating Step-by-Step 2 Alarms Select an Event in the List l Click the row of the event that you want to handle. NOTE: In some Client Profiles, you can start sending commands directly without clicking on the event first to select it. In that case you can skip this step. Also, in some configurations, certain types of events autoselect when they occur, in which case you will not have to do this step.
2 Operating Step-by-Step Alarms Check the Event Status When no further commands are available, use the Event Status and Suggested Action columns to determine the next action you need to take. A typical sequence may include: 1. Event Status = Waiting for condition: – Suggested Action = Complete operating procedure. No further commands are available because you must first complete at least the mandatory steps of the operating procedure. a.
Operating Step-by-Step 2 Alarms ● Jump to the event source in System Manager: a. In the Source column, click the name of the event source. b. System Manager opens with the event source automatically selected in System Browser. c. Use Textual Viewer or Graphics Viewer to view details about the point that issued the event. d. Use the Operation tab to view the properties of that object, and any commands available for it. e. To go back to Event List, click Open Event List in the Summary bar.
2 Operating Step-by-Step Alarms Finish Handling an Event When you have finished handling an event its Event Status changes to Closed. Depending on configuration, the event may be automatically cleared from the list. Otherwise: l Click the event button again to deselect the event and clear it from the list. 2.3.2 Handling an Event with Investigative Treatment The investigative treatment window lets you send event-handling commands while using System Manager to inspect the event source.
Operating Step-by-Step 2 Alarms for that event is replaced by a blank placeholder to indicate it is under investigative treatment. Send Event Handling Commands From the event descriptor, use the icons in the Commands column to send any commands as they become available. The commands you must send will vary depending on configuration. A typical sequence may include: 1. Click to acknowledge the event. 2.
2 Operating Step-by-Step Alarms 2. (Optional) If required, you can select other events in Event List, and send event-handling commands from there. You cannot select the event that is currently in investigative treatment. 3. To return to investigative treatment, in the Summary bar, do one of the following: – – Click Close Event List . Select Menu > Active Tasks > Investigative Treatment.
Operating Step-by-Step 2 Alarms 2.3.3 Handling Events with Assisted Treatment Assisted treatment provides a guided step-by-step procedure for handling an event. The icon on an event button indicates that an assisted treatment procedure is available for that event. Figure 5: Example of an Assisted Treatment Window Figure 6: Example of Event Button with Assisted Treatment Available Start Assisted Treatment w An event button with the icon is available in Event List, or in the Event Detail bar.
2 Operating Step-by-Step Alarms Send Event Handling Commands From the event descriptor, use the icons in the Commands column to send any commands as they become available. The commands you must send will vary depending on configuration. A typical sequence may include: 1. Click to acknowledge the event. 2. After acknowledging the event, if the event caused a field panel to sound an audible alarm in the site, click to silence the panel, or click to turn it back. 3.
Operating Step-by-Step 2 Alarms Complete the Operating Procedure The Steps pane on the left lists the tasks to perform to handle the event. Mandatory steps are marked with an exclamation mark . The step currently being executed is marked with a triangle . 1 4 5 2 6 3 Figure 7: Operating Procedure Steps 1. Click on the step you want to execute. NOTE: When you move your mouse over a step, if the pointer turns into a hand it means you can execute that step.
2 Operating Step-by-Step Alarms 3. Check off the step by clicking the white check box . This marks it as complete. a A checkmark displays in place of the check box to indicate the step was completed. An execution status icon underneath it indicates its outcome: success / failure / or in progress .
Operating Step-by-Step 2 Alarms The Assisted Treatment window is moved to the background but not closed. 2. (Optional) If required, you can select other events in Event List, and send event-handling commands from there. You cannot select the event that is currently in assisted treatment. 3. To return to assisted treatment, in the Summary bar, do one of the following: – Click Close Event List . – Select Menu > Active Tasks > Assisted Treatment.
2 Operating Step-by-Step Alarms 2.3.3.1 Executing a Document Step in Assisted Treatment w You are in the Assisted Treatment window and the operating procedure includes a document step that you want to do. Figure 8: Document Step 1. From the Steps list, select the [document step]. a The contents of the document display in the Default tab. 2. Read the document carefully and follow any instructions. 3. Click Backward or Forward to move through any other documents included in this step.
Operating Step-by-Step 2 Alarms l From the Steps list, select the [graphic step]. a A graphic of the facility displays in the Default tab. 2.3.3.3 Executing a Remote Notification Step in Assisted Treatment w You are in the Assisted Treatment window and the operating procedure includes a remote notification step that you must execute manually. Figure 10: Reno Step 1. From the Steps list, select the Remote Notification step. a The Message Status list displays in the Default tab.
2 Operating Step-by-Step Alarms – Failed, and the remote notification message status is Failed. You cannot check off the step. 2.3.3.4 Executing a Report Step in Assisted Treatment w You are in the Assisted Treatment window, and the operating procedure includes a report step that you must manually execute. For background information about the Desigo CC reporting feature, see the reference section. Figure 11: Report Step 1. From the Steps checklist, select the [report step].
Operating Step-by-Step 2 Alarms Figure 12: Treatment Form Step 1. From the Steps checklist, select the [treatment form step]. a The form that you must complete displays in the Default tab. 2. Complete the form, using the provided controls (for example, editable fields or drop-down lists) to specify the necessary information. 3. Click Save User Input 4. Click Send to Output . . a The completed form is routed to a file, email, or printer, depending on its configured output destination.
2 Operating Step-by-Step Alarms 1. From the Steps checklist, select the [alarm printout step]. a The preconfigured alarm report displays in the Default tab. When you select this step for the first time, a new report is generated. On subsequent selection, the same report is reloaded. 2. If the report contains form controls (for example, editable fields or drop-down lists), specify the necessary information and click Save User Input 3. Click Send to Output . .
Operating Step-by-Step 2 Alarms example, select a parent event and an individual child recurrence belonging to a different parent event. 2. Send event-handling commands [➙ 47] from the parent descriptor in the normal way. a Each command you send from the parent is sent to all the child recurrences as well. For example, if you acknowledge the parent event, all its recurrences are acknowledged as well.
2 Operating Step-by-Step Alarms Add, Remove, or Rearrange Columns in Event List 1. Right-click the column headers in Event List and select Customize columns. a The Customize columns dialog box displays. 2. Do one or more of the following: – To add a column to Event List, select it in the Available columns list and click Add . – To remove a column from Event List, select it in the Visible columns list and – click Remove .
Operating Step-by-Step 2 Alarms Apply a Simple Filter w You want to filter Event List by a single criterion, for example, category, date/time, discipline, or source status. 1. In the Summary bar, click the filter icon . 2. Select what you want to filter by (for example, Event Status), and then click the criterion you want to apply (for example, Unprocessed). a Event List is filtered to show only the events that match the criterion. The color of the filter icon changes to red .
2 Operating Step-by-Step Alarms Save an Event List Filter for Future Use w You applied a filter to Event List and want to save it for future reuse. 1. In the Summary bar, click the filter icon and select Advanced Filter. a The Advanced Filter dialog box opens, displaying the currently applied filter criteria. 2. Do the following: a. (Optional) Specify any filter criteria. b. In the Filter name field, enter a name. c. Click Save. a The filter is saved.
Operating Step-by-Step 2 Alarms To disable autoremove: 1. Click the filter icon and deselect Autoremove on New Events. a Any applied filters will persist even if new events come in. Manually Tag Events in Event List Event List includes a column that lets you manually tag individual events. You can then use filters to selectively show or hide events you have tagged in this way. Any tags you apply are valid only during the current client session.
2 Operating Step-by-Step Alarms – Click the filter icon and click Advanced Filter. In the dialog box, from the Tag drop-down list, select Show both tagged and untagged events. a The list of events will no longer be filtered by tags, but any other filters you applied will remain still active. Check the Event List header to see them. 2.3.7 Printing the Whole Event List 1. In Event List, right-click and select Print Event List. 2. (Optional) Modify the settings In the Print Preview dialog box. 3.
Operating Step-by-Step 2 Alarms NOTICE Alarm Transmission to Fire Department The alarm suppression feature disables the display of events concerning the affected object or subtree. The alarm functionality (for example, the fire detection system) is not affected. Consequently, any incoming alarms are still transmitted to the fire department.
2 Operating Step-by-Step Alarms Disable Alarm Suppression for an Object 1. In System Browser, select the system object with alarm suppression enabled. 2. Click the Extended Operation tab. 3. Next to the Alarm Suppression property, click Disable. a Alarm suppression is disabled for the selected object. NOTE: If the object is in alarm when you disable alarm suppression its events display in the Summary bar and Event List. Disable Alarm Suppression for an Object Subtree 1.
Operating Step-by-Step 2 Scheduling Method 2: Generate a Report 1. In System Browser, select Application View. 2. Select Applications >Reports > Status. 3. In the Default tab, click Import . 4. In the Open dialog box, do the following: a. Navigate and select the alarm suppression template: Report.Status.HQ.AlarmsSuppression.xml. b. Click Open. 5. Click OK. 6. Select Applications >Reports > Status > Alarm Suppression. a The alarm suppression report template displays in the Default tab. 7. Click Run .
2 Operating Step-by-Step Scheduling Prerequisites: ● System Browser is in Application View. Steps: 1 – Create Schedule Entries w You have created a BACnet schedule containing a data point that you want the weekly occupancy schedule to control. It is available in Schedules > BACnet Schedules in the System Browser. 1. Select Applications > Schedules > BACnet Schedules > [BACnet schedule]. 2. Select the Schedule Entries tab and click New to add a new entry. 3.
Operating Step-by-Step 2 Scheduling 6. In the remaining entry, enter 6:00:00 AM. 7. Clear the None check box. NOTE: Creating an entry with the default check box checked returns control to the weekly schedule. For example, you might want to override the schedule for one hour at 1 P.M., so you create an entry at 1 P.M. with the override value. Then, you create an entry at 2 P.M. with None checked. Control will return to the weekly schedule at 2 P.M. 8. Select OFF from the drop-down list.
2 Operating Step-by-Step Scheduling a The management station schedule of the selected type is created and a time period is assigned to the schedule. 2 – Create Schedule Entries 1. Select Applications > Schedules > Management Station Schedules > [Management Station Schedule] 2. Perform either of the following steps to add a new schedule entry. – – Navigate to the Day/Week view, right-click, and select Add Weekly Entry. Click New in the Schedule Entries tab.
Operating Step-by-Step 2 Scheduling Create a BACnet Schedule and Associate a Data Point to it w System Manager is in Operating mode. 1. Select the Manual navigation check box. 2. Select Applications > Schedules > BACnet Schedules. 3. Click New and select New BACnet Schedule. 4. Navigate to the Management View and select the field panel that contains the data point you want the schedule to control, drag-and-drop the data point to the Outputs tab.
2 Operating Step-by-Step Scheduling 3. Click Save As . 4. In the Save Object As dialog box, specify a name and the field panel you want this calendar associated with and click OK. a The calendar is saved with a new name. Delete a Calendar Perform the following steps to delete a BACnet or Management Station calendar. 1. Select either of the following: BACnet Schedules – Applications > Schedules > BACnet Calendars Management Station Schedules – Applications > Schedules > Management Station Calendars 2.
Operating Step-by-Step 2 Scheduling 3. Make the required updates to the Text Group and to the values displayed in the Command Table Action List. 4. Click Save . Create a Weekly BACnet Schedule Entry 1. Select Applications > Schedules > BACnet Schedules. 2. Open the schedule to which you want to add a new weekly schedule entry. 3. Navigate to the Day/Week view, right click and select Add Weekly Entry. 4. Click the Schedule Entries tab and enter values into the relevant fields. 5. Click Save .
2 Operating Step-by-Step Scheduling 7. Enter values into the Time and Value fields. 8. Click Save . Delete a BACnet Exception and Entries 1. Select Applications > Schedules > BACnet Schedules. 2. Open the schedule whose exception is to be deleted. a The details of the schedule display in the Day/Week view. 3. Right-click the exception you want to delete. NOTE: Exceptions are highlighted with a red bar on the left side of the entry. 4.
Operating Step-by-Step 2 Scheduling Modify a Weekly Management Station Schedule Entry 1. Select Applications > Schedules > Management Station Schedules. 2. Open the schedule you want to modify. 3. In the Day/Week view, click the weekly schedule you want to modify. Schedules are highlighted with a blue bar on the side of the entry. 4. In the Schedule Entries tab, modify the Time and Value fields as needed. NOTE: You can also drag the blocks up and down in the daily and weekly views to adjust the time.
2 Operating Step-by-Step Scheduling Delete a Management Station Exception and Entries 1. Select Applications > Schedules > Management Station Schedules. 2. Open the schedule with the exception you want to delete. a The details of the schedule display in the Day/Week view. 3. Right-click the exception you want to delete. NOTE: Exceptions are highlighted with a red bar on the left side of the entry. 4. Do one of the following: – To delete the exception, select Delete Exception.
Operating Step-by-Step 2 Reports Zoom In and Zoom Out w You want to decrease or increase the viewable span of the timeline. 1. Click Zoom In or Zoom Out . NOTE: Each time you click the icon, the timeline decreases or increases to the next preset time period. 2.5 Reports This section provides instructions for using the Reports of Desigo CC. For background information, see the reference section. 2.5.
2 Operating Step-by-Step Reports – Click Run As to run the report definition according to the selected language. a Localized data is retrieved and loaded in the cells of a table/plot in the report. a The report execution status displays in the Report Management section below the report definition. On successful report execution, the generated report displays in Run mode. Option 2: Using The Related Items Tab 1. Select an object from System Browser.
Operating Step-by-Step 2 Reports Figure 15: 3 – View a Report You can view a report as a PDF output or as an Excel output. Option 1: Viewing a Report Definition as a PDF 1. For viewing a report definition as a PDF, click Create and view PDF . a The PDF file opens in the PDF viewer. When a PDF document exceeds the page limit of 500 pages, it splits into two documents. You can save, print, zoom in, and zoom out of the PDF file.
2 Operating Step-by-Step Reports Option 2: Viewing a Report Definition in the Excel format 1. For viewing a report definition in the Excel format without a template, click Create and view Excel . a An Excel file is created and stored under the following temporary path [Drive]:\Users\[UserID]\AppData\Local\Temp\temp\GMS. A dialog box displays, asks you if you want to save a permanent copy of this file.
Operating Step-by-Step 2 Reports Prerequisites: ● For configuring the report output as an email, you have configured the mail server or have verified that it has been configured. ● Email addresses are configured in address book. ● For configuring the report output to the printer, ensure that one or more local printers are configured. Steps: 1 – Select a Standard Report for Configuration 1. In System Browser, select Application View. 2. Select Applications > Reports. 3.
2 Operating Step-by-Step Reports – – – Time Filter [➙ 95]: Displays data that matches with the specified date/time value. Row Filter [➙ 96]: Displays the number of rows specified. Graphics Filter [➙ 96]: Displays the graphics and viewports of the object that is passed as the name filter to the report. 2. Save the report definition by clicking Save . a The report is configured according to the specified filters.
Operating Step-by-Step 2 Reports Management System > Servers > Main Server > Report Manager > Report Default Folder. This path must be the relative path of the project and not the full path. For example, if the report is to be routed to [Drive]:\GMSProjects\[Customer Project]\data\Reporting\Reports, the following relative path must be specified in the Location field, data\Reporting\Reports. 2.5.3 Additional Report Procedures Select any of the procedures for additional information on Reports. 2.5.3.
2 Operating Step-by-Step Reports 4. Browse for the folder where the exported .xml files or logo files were created and saved after exporting a report definition. If you import a report definition with the same name that already exists under the folder selected for import, the existing report definitions with the same names are overwritten. 5. Select single or multiple .xml and any associated logo files (.jpeg, .gif, .png, and so on). – – – Use the CTRL key to select multiple files.
Operating Step-by-Step 2 Reports from the report definition; Text (Labels), Keywords, and Logos remain in the header/footer section. a The report definition is saved as a default template. NOTE: There can only be one default template. You can create a new one or use the one provided by the system. When you create a new template, the existing default template is overwritten. Create a New Report Definition 1. In System Browser, select Application View. 2. Select Application View > Applications > Reports.
2 Operating Step-by-Step Reports Abort a Running Report Definition 1. In System Browser, select Application View. 2. Select Applications > Reports. 3. Click Stop . a A report is populated with the data gathered before the report execution was stopped. NOTE: You can stop creating a PDF or XLS document in the same way. Viewing a Report Definition in the Excel format with a Template 1. Click Create and view Excel .
Operating Step-by-Step 2 Reports 14. Save the Excel document. a The saved Excel document is a template that contains the PivotTable. 15. Select the report definition you created. 16. From the Extended Operation tab, specify the path of the template in the Excel Output Template field and click Set. By default, the Excel Output Template field does not display in the Extended Operation tab.
2 Operating Step-by-Step Reports the Type drop-down list. The columns related to the object type selected are filtered and displayed in the Available Columns list. If you select a column that belongs to a property, then the column is added in the Property column format, such as High Limit.ActivityLog. a The checked columns are added to the Selected Columns list. 5. Click OK. a The columns are added to the table in order of their presence in the Selected Columns list. 6.
Operating Step-by-Step 2 Reports - Select a keyword from the Keyword group box and drag-and-drop it onto the blank text. - Right-click the blank text and select the required keyword from the Insert Keyword option. a The keyword is inserted. NOTE: To delete a keyword, you must delete the label containing that keyword. Insert Labels w You have selected an existing report definition in System Browser > Reports or you have created a report definition and now want to configure it. 1.
2 Operating Step-by-Step Reports NOTE 1: You can change the position of the logo in the report definition by using the Move buttons (up , down , top , bottom ) in the Placement group box of the Layout tab, or by right-clicking a logo in the report definition, and selecting Move. NOTE 3: To delete a logo, click the logo and press the Delete key. You delete a logo from the source directory using the Manage Logo command in the Logo group box.
Operating Step-by-Step 2 Reports Text Group Selection Control 1. Do one of the following: – From the Insert group box on the Home tab, click the Form Controls group box, select the Text Group Selection control, and drag-and-drop it in the report definition or in the header/footer section. – Right-click the report definition or the header/footer section, where you want to insert the Text Group Selection control, and then select Insert Text Group Selection. a The Text Group Selection control is added. 2.
2 Operating Step-by-Step Reports margins of a page as well as the header and footer margins by selecting the More Margins option. 3. Select the margin of your choice. a The margin of the report changes. NOTE 1: In the Page Setup dialog box, all fields in the Margins section accept only integer and floating point values. NOTE 2: A negative value entered highlights the text field in red.
Operating Step-by-Step 2 Reports Adjust Postions of Report Elements 1. Select a report element in a report definition. a The menus in the Position group box become available. 2. You can adjust the position of the report element by doing one of the following: – – Use the Position group box. Click Dialog Launcher or right-click and select Position to open the Position dialog box. 3. To set the alignment, click the required alignment type. 4.
2 Operating Step-by-Step Reports – – Select a predefined color (in square boxes). Click the More Color option and select a custom color in the More Color dialog box. 4. Click OK. 2.5.3.3 Working with Report Tables You can perform the following operations on tables in reports. Customize a Column Header You can customize the column heading in tables as per your requirement using the Select Columns dialog box.
Operating Step-by-Step Reports – 2 User and Management Station columns are automatically filled in with their respective read-only values. Modifying an entry: Click Edit next to the row with your comments to make it editable. Perform the required updates and press ENTER to update the comments. You can edit only your own comments. – Deleting an entry: Click Delete next to the row with your comments. Select Rows in Tables l Select a single or multiple rows in a reports table in the Run mode.
2 Operating Step-by-Step Reports 4. Generate an Excel or PDF output by clicking Create and view Excel Create and view PDF or . 5. Depending on the type of data (Objects or Trends) to be displayed for the deleted objects, perform the following steps: a. To view activity related information of deleted objects, insert the Orphan Activities table. b. To view the event related information of deleted objects, insert the Orphan Events table. c.
Operating Step-by-Step 2 Reports default filter *:* is replaced by the hierarchy of the dragged and dropped object. 5. Click New. a The Name filter is added to the Name Filter list. 6. Click OK. a The Name filter is added to the Name Filter group box. NOTE: You can apply multiple Name filters on all tables except for a Trends table. For BACnet tables, applying multiple Name filters is possible, but the Children check box is unavailable. Condition Filter 1.
2 Operating Step-by-Step Reports 3. For Events and Event Details table only, select the column on which you want to apply the time filter from the Select Column drop-down list. 4. Select the appropriate values for Date/Time type: Exact, Custom, or Relative. 5. Click OK. NOTE: By default, the Unlimited option is selected. a The Time filter is added in the Time Filter group box. Graphics Filter 1. Select the report to which you want to apply the graphics filter. 2.
Operating Step-by-Step 2 Reports 11. Select the required report format (PDF, XLS, CSV, or XML) in the Report format list. 12. Select File in the Destination types list. 13. From the File drop-down list, select the destination folder where you want to save the file. a The File drop-down list displays all the report output folders that you have configured. 14. Select Enter custom file name to add the file name. The default option is Use report name as file name. 15.
2 Operating Step-by-Step Reports box. However, if the configured email address is deleted or the recipient is deleted in the Address Book, the entries for a report definition display in red. For more information, see the Automatic Update of Configured Email Addresses. 3. Select the required contacts by selecting the check box preceding each contact. 4. Click OK. a The selected contacts are displayed in the Destination field in the Report Output Definition dialog box.
Operating Step-by-Step 2 Reports 2.5.3.6 Configuring Automatic Report Execution You can schedule automatic report execution through macros, reactions, and graphics. Automatic Report Execution through a Macro w System Manager is in Engineering mode. w You have configured the destination (file, email, or printer) to which you want to route the report output. 1. In System Browser, select Application View. 2. Select Applications > Logics > Macros. a The Macro tab displays. 3.
2 Operating Step-by-Step Reports Automatic Report Execution through Reactions w System Manager is in Engineering mode. w You have configured the destination (file, email, or printer) to which you want to route the report output. 1. In System Browser, select Application View. 2. Select Applications > Logics > Reactions. a The Reaction Editor tab displays. 3. In the Reaction Editor tab, open the Output expander. 4. From the Output expander, open the Action expander. 5.
Operating Step-by-Step Reports 2 1. In System Browser, select Application View. 2. Select Applications > Graphics. 3. Click Edit . a The Graphics application displays in Edit mode. 4. Click New and select New Graphic. 5. Click the Options tab and select the Command option. 6. In System Browser, expand the Reports folder and drag-and-drop the report definition to be executed to the window labeled Untitled in the Graphics editor. 7. Click Save. a The graphic is stored below the Graphics folder. 8.
2 Operating Step-by-Step Reports Print Automatically Generated Reports 1. Select Applications > Reports. 2. Click the Settings tab. 3. From the Report Output group box, click Dialog Launcher a The Report Output Definition dialog box displays. . 4. In the Report format list, select PDF. 5. In the Destination types list, select Printer and specify the other printer details. 6. Click Add. a The selected format and destination are added to the Output Definition list. 7. Click OK.
Operating Step-by-Step Reports 2 3. In the Type filter field, enter the object type description. a The Type drop-down list displays the object types. 4. On the Type drop-down list, select the object type. 5. Click Load. a The columns are listed in the Available columns list. 6. Select the property and/or attribute to display as columns in the table. a The list of selected columns displays in the Selected Columns list. NOTE: To remove columns that you do not want displayed in the table, click . 7.
2 Operating Step-by-Step Reports 11. Perform the following steps to apply the Condition filter: a. Enter BACnet in the Type filter field to display all BACnet related objects in the Type drop-down list. b. Select the BACnet Analog Output Object from the Type drop-down list. c. Click the Load button. All the common columns and columns specific to the selected object display in the Available columns list. d. Select the column on which you want to add the condition filter.
Operating Step-by-Step Reports 2 adding/removing columns or by setting additional objects as name filter or by removing existing objects from the name filter. 2.5.4.2 Configuring an Activities Report Scenario: You want to create an activities report to determine the number of times the Present Value property of an Analog Input object has exceeded 100 in the last 24 hours.
2 Operating Step-by-Step Reports 5. Specify the time period by adding the Time filter to the report definition. Perform the following steps to add the Time filter. a. Right-click the Activities table, point to Filters and select Time Filter. The Time Filter dialog box displays. b. Select the Relative option. c. Select the Last or Current Period option, depending on the data requirement for the last 24-hour period or current 24-hour period.
Operating Step-by-Step Reports 2 6. Run the report to view the data. a The report displays the data for analog input object where value is greater than 100 in the last 24-hours. 7. (Optional) Click Save. 2.5.4.3 Viewing Event Details using Assisted Treatment Scenario: You want to create an event details report that displays the details of a particular event using Assisted Treatment. w A template for operating procedures is available and the Operational Status property for the template is set to Enabled.
2 Operating Step-by-Step Reports 2. Click before the event entry. a Additional information related to the event such as Time, Action, User Name, Management Station, Attachment, Value, and Previous Value display as child records. 3. Perform the required steps to treat the event from the Contextual pane. 4. Click Send to Output . a The report is routed to the configured destination. 2.5.4.
Operating Step-by-Step Reports 2 1. (Optional) Add any extra columns to the parent table from the Parent tab in the Select Columns dialog box. You can add the extra columns to the child table from the Child tab. To display this dialog box, you must right-click the table and select Select Columns. 2. From System Browser, drag-and-drop the analog output object (For example, Analog Output 1) whose event details are to be monitored to the Event Details table. This object acts as the name filter. 3.
2 Operating Step-by-Step Reports requirement for the last 24 hour period or current 24 hour period. For more information regarding setting the time period, see Time Filter. In this case, as we want the data for the current 24-hour period, select Current Period and specify 24 hours. d. Click OK. 6. Run the report to view the data. a The report displays the details of any Fault or Life Safety events that occurred on the Analog Output 1 object in the current 24-hour period. 7.
Operating Step-by-Step Reports 2 1. Double-click the event in the Event bar. a The event details display in the Related Items tab. 2. Perform the required steps to treat the event. 3. Select the report containing the Event Details table from the Related Items tab. a The report executes in the Secondary pane and the information related to the event time, category, cause, ID, object description, and designation displays in the report. 4. Click before the event entry.
2 Operating Step-by-Step Reports 2. From System Browser, drag-and-drop the Trend View Definition to the Trends Plot. This acts as a name filter to the plot. 3. Specify the time period by adding a Time filter to the plot. Perform the following steps to add the Time filter: a. Right-click the Trends Plot, point to Filters and select Time Filter. b. In the Time Filter dialog box, select the Relative option. c.
Operating Step-by-Step Reports 2 4. Run the report to view the data. a The report displays the graphical representation of the data for the current 10 hour period.
2 Operating Step-by-Step Reports 5. Save the report definition. NOTE: You can enhance the report configuration at any time, in the future, by changing the Name and Time filters. 2.5.4.7 Configuring a Report Using In Operator Scenario: You want to configure a report that displays the data for some objects and you want to view the data for only those objects that are linked to a graphic. w Ensure that you have configured an Objects report that displays the data of some objects. 1.
Operating Step-by-Step Reports 2 3. Click OK. 4. Run the report. a The generated report displays the data for only those objects that have a graphic linked to them.
2 Operating Step-by-Step Trends 2.6 Trends This section provides instructions for using the Trends of Desigo CC. For background information, see the reference section. 2.6.1 Creating an Online Trend Scenario: You want to view the data in a trend view definition, configure it, and print the contents. Reference: For background information, see the reference section.
Operating Step-by-Step Trends 2 2 – Analyze the Trend Data l Specify the time range for which you want to display the data displayed in the trend view from the following: – Select the time range from the time range scrollbar [➙ 124] – Select the time range from a list of predefined time ranges [➙ 126] – Select an absolute time range [➙ 124] – Select a relative time range from the current date [➙ 126] – Select a relative time range from the start date [➙ 125] – Select a relative time range from the stop d
2 Operating Step-by-Step Trends 5. Click Save . a The edited properties are saved to the Trend database. Define the Axis Properties 1. Click Properties . 2. Click the Axis Properties tab. 3. Enter a title for the Left axis property, Right axis property, and X-axis property. 4. Click Save . a The edited properties display in the Trend View. Position the legend 1. Click Properties . 2. Click the Legend Properties tab. 3.
Operating Step-by-Step 2 Trends NOTE: Do not select a thick line if you want to display the Trend curve with a marker. The marker will disappear behind a thick line. Display Markers Markers allow you to further emphasize the measurement time using a symbol . w The Show quality icons property must be selected. 1. Select the series for editing from the legend for the Trend View. 2. Click Properties . 3. Click the Series Properties tab. 4. Select the Show markers check box.
2 Operating Step-by-Step Trends 5. Click Save . a The current measured values are updated in the chart each time the measured value of a data point changes. 6. Click Stop . a The measured values display on the Trend View. NOTE: Measured values display on top of one another when the changes to the measured values occur in quick succession or the selected time range is too large. Since the measured values are no longer readable, select a smaller time range or switch off the labels.
Operating Step-by-Step Trends 4. In the drop-down list, select Y-axis position 5. Click Save 2 . . a The Y-axis displays either on the left or right side of the chart. NOTE: The position is set and cannot be changed for digital and multistate data types. Edit Background or Line Colors 1. Click Properties . 2. Do one of the following: – – Click the Chart Properties tab to change the background color. Click the Series Properties tab to change the line color for a series. 3.
2 Operating Step-by-Step Trends Create a Trend View Definition 1. In System Browser, select Application View. 2. Select Trends > Trend View Definitions. a The Trend application opens. 3. Click New > New Trend . 4. In System Browser, select Management View. 5. Select Project > Field Networks > [network type] > Hardware > [device]. 6. In System Browser, select the corresponding data point (do not click the data point).
Operating Step-by-Step Trends 2 Create and Delete Trend View Folders 1. In System Browser, select Applications > Trends. a Trends displays. 2. Select Trend View Definitions. 3. Do one of the following: – To create a new Trends folder: a. Click New . b. Select New Folder . c. In the New Object dialog box, enter a name and description. d. Click OK. a The new Trends folder is saved. You can create additional sub-folders as needed.
2 Operating Step-by-Step Trends User Default Yes No X Background color of the Trend View. X X Legend position in the Trend View. Show/hide columns. X 2.6.2.2 Property Adjust column width. X Move columns. X Series properties. X Axes properties.
Operating Step-by-Step Trends 2 Select Absolute Time Range w You are in an active Trend View. 1. Right-click the Time Range bar and from the menu options select the Select range option. a The Select Date/Time dialog box displays. 2. From the Selection type drop-down list, select Absolute. 3. Click the displayed Start time. a The Calendar dialog box opens. 4. Enter the desired start date in the Calendar dialog field. – – Select month and year with the symbols. Click the appropriate date. 5.
2 Operating Step-by-Step Trends Select Relative Time Range from a Stop Date w You are in an active Trend View. 1. Right-click the Time Range bar. 2. Click Select range. a The Select Date/Time window displays. 3. From the Selection type drop-down list, select Relative. 4. In the Interval text field, enter a time range from 1 to X and select the corresponding time unit in the drop-down list. 5. From the Start/end time drop-down list, select Ending. 6.
Operating Step-by-Step Trends 2 NOTE: The display calculation is always based on current visible date range. Depending on the position of the current Trend View, the starting point may not be at the start of the day. Start/Stop Range w You are in an active Trend View. 1. In the Trend View, point the mouse to the left or right end point (dark grey area) for the Time Range slider. a The mouse pointer changes shape and the tooltip displays. 2. Right-click the Time Range slider.
2 Operating Step-by-Step Trends Use Mouse Zoom The zoom function allows you to select a time range in the currently selected Trend View (applies as well for the comparison view) by zooming in on the X-axis and Yaxis. w You are in an active Trend View and in the Stop mode. 1. Click Zoom . 2. Navigate to the left zoom starting range. a The point changes shape and the tooltip displays the current position. 3. Drag the pointer to the right zoom end range.
Operating Step-by-Step Trends 2 4. Clear the Visible check box. a The menu bar is hidden. a The series is hidden in the Trend View. a The Trend data is still recorded for this series, but is no longer displayed. 5. Click Save . 6. Repeat Steps 2 through 4 for any additional series you want to hide. NOTE: You can also click or on the legend to show or hide each individual trend curve. Remove Data Series from Trend View w Multiple trend curves display in the Trend View. 1.
2 Operating Step-by-Step Trends – Right-click the Report Definition and select the required type of plot from the Insert Plot option. – Drag-and-drop the desired Trend View Definition from System Browser on the Report Definition. The Name filter of the inserted plot is set to the dropped Trend View. a The plot placeholder is added to the Report Definition. By default, the plot is left-aligned. NOTE: In Run mode, this plot image is replaced by the actual data retrieved from the Report service. 3.
Operating Step-by-Step Trends 2 2. Click the Manual Correction link. a The Manual Correction application displays in the Secondary pane and the trended object you selected displays in the Trended Object field in the Object filter section. 3. Select the corresponding property whose details are to be viewed from the Trended Properties drop-down list. 4. Specify the time range for which you want to view the details by specifying the date and time in the Time filter section.
2 Operating Step-by-Step Trends Time filter 1. Navigate to the Time column and click the inverted triangle icon. 2. On the menu, position your mouse pointer over Time Filter. A sub-menu with the Hours and Minutes options displays. 3. Depending on the filtering criteria to be applied, perform any of the following steps: – – To filter data on the basis of number of hours - Position your mouse pointer over the Hours menu and select the relevant option.
Operating Step-by-Step Trends 2 3. Enter a comment and click OK. 4. Click Run . a The entries are deleted. 2.6.2.5 Additional Offline Trend Logs Procedures Perform the following procedures to work with offline trend log objects. Upload Trend Data from the System Browser 1. In System Browser, select Application View. 2. Select Applications > Trend > Offline Log Objects. 3. Select one or more trend log objects or trend log multiple objects. a The trend view displays as follows.
2 Operating Step-by-Step Trends Upload Trend Data from the Legend w A Trend View is open. The red curve indicates that the offline trend data is not yet updated. The blue curve indicates the online trend data. 1. In the legend, select one or more trended objects whose associated trend data you want to upload to the management station. 2. Right-click the selected trended object and then select Display Trendlog Object in Contextual pane. 3. Click the Extended Operation tab.
Operating Step-by-Step Trends – – 2 To upload the trend data related to all the trend log objects or trend log multiple objects, navigate to the Log Enable property and click Collect. To upload the trend data related to a specific trend log object or trend log multiple object, expand the Log Enable property and click Collect. a The offline trend data from the trend log objects or trend log multiple objects is uploaded to the management station. The red curve indicates the updated Offline Trend data.
2 Operating Step-by-Step Trends 7. In the Buffer Size expander specify a size for the buffer in the Buffer Size field. Select the Stop when full check box if you want to stop the collection of trend values in the buffer when the buffer reaches the specified value. 8. Expand the Start/Stop expander and specify the period for which you want to collect trend values by specifying the date and time values. 9. Click Start Creation . a The results of the bulk operation display. 10. Click OK.
Operating Step-by-Step Trends 2 1. Select one or more BACnet points of the same type (for example, all analog input or analog output) for which you want to create trends on the property other than the default. 2. Right-click and select Change Property. a The Change Property dialog displays with the list of all the properties that can be trended. 3. Select the desired property and click OK. a The objects reflect with the modified property. Modify Trend Log Objects in Bulk 1.
2 Operating Step-by-Step Trends Add Points to Trend View or Edit mode 1. In System Browser, select Management View. 2. Navigate to Project > Field Networks > [network]. 3. Perform either of the following steps to add the points to the Trend View or in the Edit mode. To add points to the Edit mode, click Edit Trend . – Select the Manual navigation check box in the System Browser. Select the BACnet points for which you want to create trend log objects.
Operating Step-by-Step Log Viewer 2 2.7 Log Viewer This section provides instructions for using the Log Viewer of Desigo CC. For background information, see the reference section. 2.7.1 Configuring and Printing the Log View Details Scenario: You want to configure a log view, print, and save its details. Reference: For background information, see Log Viewer reference.
2 Operating Step-by-Step Log Viewer priority, the priority of other sorted columns changes. Additionally, the data in the log view is re-ordered based on the new priority. Re-selecting the hidden column from the Select Columns dialog box does not retain its sort order and priority. a The data displays in the sorted order and a priority is assigned in case the sorting is applied to more than one columns. When you save the data as a log view definition, the sort criteria is also saved.
Operating Step-by-Step Log Viewer 2 2.7.3 Configuring and Printing Detailed Log Scenario: You want to configure a detailed log and print its details. Reference: For background information, see Log Viewer reference.
2 Operating Step-by-Step Log Viewer 2 – Configure the Detailed Log Parameters You can configure the information displayed in the Detailed Log tab by selecting the required columns, removing unwanted columns, sorting entries, and condensing the displayed data by applying filters. 1. Select an activity or event type record from the log view, an object from the System Browser or any application supporting secondary selection, or an event from the event list.
Operating Step-by-Step Log Viewer 2 NOTE: The size of the font may vary depending on the number of columns in the log view grid. 2.7.4 Additional Log Viewer Procedures Select any of the procedures for additional information on Log Viewer. 2.7.4.1 Managing Log View Definitions and Folders This section provides information on organizing and working with log view definitions. Export a Log View Definition 1. In System Browser, select Application View. 2.
2 Operating Step-by-Step Log Viewer 1. Click Save As . 2. In the Save Object As dialog box, do the following: a. Select the destination folder for saving the new log view definition. b. Enter a name and description. c. Click OK. a The new log view definition is saved. NOTE: You cannot save a result filter condition. In order to save the filter condition, you must move the result filter to a search filter and save the configuration as a log view definition.
Operating Step-by-Step Log Viewer 2 1. (Optional) Configure the log view by selecting, reordering, or resizing the columns. You can also apply sorting on the displayed data. 2. Click Save as Default. a A message box displays. 3. Click Yes. a The log view is saved as a default template. NOTE: View-specific columns in the log view template display in red color, if the view is deleted. You can get the details of the invalid columns by double-clicking the header text.
2 Operating Step-by-Step Log Viewer NOTE: For each view present in the system, you can add the view-specific columns (Object Location and Object Designation) to a log view from the Select Columns dialog box. If you run the log view definition from the Secondary pane and activities such as renaming a view are done in the Primary pane, the effect of these changes reflect in the log view definition only after you click Refresh.
Operating Step-by-Step Log Viewer 2 3. Click the Result Filter tab. 4. Click the Add Filter button. a An empty row with the Operator and Value fields displays. 5. Specify the operator by selecting values from the Operator and Value dropdrop down list. a The filter expression displays in the Filter Expression field. 6. Click OK. a The result filter is applied to the data set. Quick Filter 1. Right-click the data value for which you want to apply the filter. 2. Select the Filter By option.
2 Operating Step-by-Step Log Viewer 2. Select the checkbox pertaining to the entry on which you want to apply the filter. NOTE: For faster retrieval of the data entries, you can type the value of the entry to be retrieved in the text box above the Selection filter. 3. Click OK. a The view displays the data filtered on the basis of the selected entry. If you select more than one data entry, the system displays the data matching either of the selected entries.
Operating Step-by-Step Log Viewer 2 3. Click the Result Filter tab. 4. Specify the appropriate date/time values in the Exact, Custom, or Relative options. NOTE: By default, the Unlimited option is selected in the Time Filter dialog box. If you want to view records having NULL as the value, select the Null option. a A preview of the date/time values you specified displays in the Preview of Resulting Time Range section. 5. Click OK.
2 Operating Step-by-Step Log Viewer 1. Click the drop-down arrow on any column displaying date/time data, for example, Date/Time. A list of menu options displays. 2. Position your mouse pointer over Date Filters. A list of options to filter the data on the basis of the current day (Today), previous day (Yesterday), current week (This Week), previous week (Last Week), current month (This Month), previous month (Last Month), current year (This Year), or previous year (Last Year) displays. 3.
Operating Step-by-Step Log Viewer 2 4. Enter the appropriate date/time values in the Exact, Custom, or Relative options. NOTE: By default, the Unlimited option is selected in the Time Filter dialog box. If you want to view records having NULL as the value, select the Null option. a A preview of the date/time values you specified displays in the Preview of Resulting Time Range section. 5. Click OK. 6. The log view refreshes and the data corresponding to the specified date time values displays.
2 Operating Step-by-Step Log Viewer 5. Click Remove Filter. 6. Click OK. a The log view refreshes and displays all the data from the database. Delete Search Filters on Date/Time Columns w Log data displays in the Log Viewer or the Detailed Log tab. w You have applied a search filter to a column displaying date time data. 1. Right-click the data value in the column pertaining to the filter to be modified. 2. Select Custom Filter. a The Time Filter dialog box displays. 3. Click the Search Filter tab. 4.
Operating Step-by-Step Log Viewer 2 NOTE: When you move a result filter on a column to a search filter, any existing search filter present on the same column is replaced. Revert to Saved Search Filters The Revert to Saved Search Filter function enables you to obtain the data provided by a previously defined search filter that is now being overwritten by a newly applied filter. For example, assume you apply a result filter on the log view to display all records of type Activity.
2 Operating Step-by-Step Log Viewer 5. Click OK. a The log view refreshes. Modify Search Filters on Columns Not Present in the Log View w Log data displays in the Log Viewer or the Detailed Log tab. w You have applied a search filter to a log view definition. 1. Click Search Filter . a The Search Filter dialog box displays with the filter expression in the Filter Expression field. 2. Click the filter expression.
Operating Step-by-Step Log Viewer 2 1. Right-click the data value for which you want to apply the filter. 2. Select Custom Filter. a The Custom Filter Dialog Box displays. 3. Click the Result Filter tab. 4. Click the Add Filter button. a An empty row with the Operator and Value fields displays. 5. Specify the operator by selecting values from the Operator and Value dropdrop down list. a The filter expression displays in the Filter Expression field. 6. Click OK.
2 Operating Step-by-Step Log Viewer 2. Select the checkbox pertaining to the entry on which you want to apply the filter. NOTE: For faster retrieval of the data entries, you can type the value of the entry to be retrieved in the text box above the selection filter. 3. Click OK. a The view displays the data filtered on the basis of the selected entry. NOTE: If you select more than one data entry, the system displays the data matching either of the selected entries.
Operating Step-by-Step Log Viewer 2 3. Click the Result Filter tab. 4. Specify the appropriate date/time values in the Exact, Custom, or Relative options. NOTE: By default, the Unlimited option is selected in the Time Filter dialog box. If you want to view records having NULL as the value, select the Null option. a A preview of the date/time values you specified displays in the Preview of Resulting Time Range section. 5. Click OK.
2 Operating Step-by-Step Address Book 1. Click the drop-down arrow on any column displaying date/time data, for example, Date/Time. A list of menu options displays. 2. Position your mouse pointer over Date Filters. A list of options to filter the data on the basis of the current day (Today), previous day (Yesterday), current week (This Week), previous week (Last Week), current month (This Month), previous month (Last Month), current year (This Year), or previous year (Last Year) displays. 3.
Operating Step-by-Step Address Book 5. Click Save 2 . a The contact is added to the list. You can now configure the contact to receive reports or remote notifications, as needed. Configure a Contact to Receive Reports Reports are sent by email and addressed to individual contacts. To be able to receive a report, a contact must have at least an email address configured. 1. In the Address Book workspace, select the contact in the list. a The Details expander displays the contact’s information. 2.
2 Operating Step-by-Step Remote Notifications Import Outlook Contacts into the Address Book w You have a CSV file containing the contacts exported from Microsoft Outlook, which meets the requirements set out in Outlook Import Rules for the Address Book [➙ 329]. 1. Copy the CSV file to removable storage or to a location you can access from the Desigo CC computer. 2. In System Browser, select Application View. 3. Select Applications > Address Book. a The Address Book workspace displays. 4.
Operating Step-by-Step Remote Notifications 2 tags you want to use from the Message Tags list into the Subject and Body fields. You can also directly enter text. The subject line cannot be empty. b. In the Device drop-down list, select SMS. Drag-and-drop any automatic tags you want to use from the Message Tags list into the Body field. You can also directly enter text. The maximum message length is 480 characters (divided into three messages). Longer text messages will be cut off. 5.
2 Operating Step-by-Step Remote Notifications Re-Send a Remote Notification from the Message Status List You want to re-send a remote notification that was previously not completed successfully. For example, its overall outcome was Failed or Aborted. For more details, see Remote Notifications Message Status List [➙ 331]. 1. In System Browser, select Applications > Remote Notifications. a The RENO Messages tab displays.
Operating Step-by-Step Logics 2 Stop a Remote Notification from the Message Status List You want to interrupt sending of a remote notification that is currently in progress. w You are displaying the Message Status list. See Remote Notifications Message Status List [➙ 331]. 1. In the Message Status list, select the remote notification that is currently being sent (its overall outcome will display as Running). a The Stop RENO procedure icon is enabled if the notification can be stopped. 2.
2 Operating Step-by-Step Logics 3. To examine a particular macro, select it in System Browser. a Properties and commands for the selected macro display in the Operation tab. 2.10.1.2 Manually Executing the Project Backup Macro You can make a backup of the project database using the predefined system macro provided for this purpose. 1. In System Browser, select Application View. 2. Select Applications > Logics > Macros > Backups > Backup Online. 3. In the Operation tab, click Execute.
Operating Step-by-Step Logics 2 1. In System Browser, select Application View. 2. Expand Applications > Logics > Macros > Block Command Macros. a The available block command macros display underneath. The naming pattern is BLOCK_[COMMAND]_[network name]. For example, BLOCK_ACK_network1. 3. Select the block command macro you want to use. 4. In the Operation tab, click Execute. a The command is broadcast to all the devices on the network.
2 Operating Step-by-Step Documents 2.11 Documents This section provides instructions for viewing documents, files, web links and other resources in Desigo CC. For background information see the reference [➙ 339] section. 2.11.1 Documents This section provides instructions for viewing relevant documents or web links in Desigo CC. View all the Documents Configured in the System 1. In System Browser, select Application View. 2. Select Applications > Documents.
Operating Step-by-Step Other Applications 2 1. In System Browser, select Application View. 2. Select Applications > Links > [fixed link]. a The Application Viewer tab displays. 3. Click Set credentials . 4. In the Web Viewer dialog box, enter your user name and password. 5. Click OK. Clear Credentials for a Fixed Link w System Manager is in Operating mode.
2 Operating Step-by-Step Other Applications 2.12.1.3 Managing Fixed Links Create a Fixed Link for a Web Application w System Manager is in Operating mode. w The Application Viewer tab displays the external web application for the system object selected in System Browser. w You created one or more Links subfolders. w You want to create a favorite fixed link to quick access this external web application. 1. Click Save As . 2.
Operating Step-by-Step Other Applications – – 2 In the drop-down list, select People or Group. A list of individuals or groups displays. Type the name or the group you want to add. The specified individual or group displays. NOTE: When you press ENTER, the query is temporarily saved in the drop-down list. 5. From the list of individuals or groups, use the > and < arrows to add or remove names or groups to and from the Recipients section. 6.
2 Operating Step-by-Step Other Applications a The system records the changes in the Log Viewer.
Operating Reference System Manager 3 3 Operating Reference 3.1 System Manager This section provides background information relating to the System Manager window. For related procedures, see the step-by-step [➙ 22] section. 3.1.1 Overview of System Manager This section provides reference and background information for using the System Manager window. For related procedures, see Working with System Manager [➙ 22].
3 Operating Reference System Manager 2 Primary pane. Contains one or more tabs associated with the object you selected in the Selection pane. These tabs can include: ● Textual Viewer: Displays information about the object such as its path, status, and so on. ● Default: If the selected object has an associated default application (for example a graphics viewer, or a tool for reporting), it displays in this tab).
Operating Reference System Manager 3 3. Click one of the links in the Related Items list (4) to open it in the Secondary (5) (or Primary) pane. This provides additional information or resources relevant to the selected object. 4. Continue making selections, in both the Primary and Secondary pane, to immediately view the associated information and commands in the Contextual pane.
3 Operating Reference System Manager 1 3 4 2 NOTE: System Browser supports drag-and-drop of single or multiple objects from any of the views—including the Search Result view. You can cancel a dragging operation by pressing the ESC key or by dragging the objects back to the original view (or other no-drop zone) and dropping them. Operating and Engineering Mode When you log onto Desigo CC , System Manager starts in Operating mode.
Operating Reference 3 System Manager 1 2 3 Figure 16: System Manager - Operating Mode 1 System Manager Operating mode is indicated by a light blue color. 2 Depending on the object selected in System Browser, the Primary pane displays only the Textual Viewer tab or the Textual Viewer and other tabs. Each tab gives access to the related operating application. 3 The Operating button is available only if you have access rights for Engineering mode; otherwise, it does not display.
3 Operating Reference System Manager Figure 17: System Manager - Engineering Mode NOTE: The application rights can only be changed in Engineering mode. So if you do not have engineering rights, these can only be enabled for you by another user who already has engineering rights. After this happens, the Operating/Engineering button will display in System Manager.
Operating Reference System Manager 3 Navigation Bar Icons Name Description Back Forward Let you quickly return to recently-viewed selections. See Revisit Recent Selections from the Navigation Bar [➙ 27]. History Displays a list of your 20 most recently viewed selections with the current selection highlighted with a checkmark and displayed in the Primary pane.
3 Operating Reference System Manager System Manager Does Not Display If System Manager is not currently visible in the main work area of the system screen, you can display it as follows: 1. If the Help window is currently open, close it by clicking in its title bar. (Otherwise, the Help window always stays in the foreground and prevents others from displaying).
Operating Reference System Manager 3 After the search results display, you can save the search by clicking Save As entering a name in the Save Search field, and then clicking Save , . The system saves the search to your own local user profile, and the search then becomes available only to you. You access saved searches by clicking the drop-down list arrow in the Search list box.
3 Operating Reference System Manager Display Modes for Objects Display Mode Example Show Description Air Handler Unit 1 Show Description [Name] Air Handler Unit 1 [AHU1] Show Name AHU1 Show Name [Description] AHU1 [Air Handler Unit 1] Views You can select from different views of the object types in the building control system, depending on how your system is set up. Selecting a view does not change the physical makeup of the system.
Operating Reference System Manager 3 6 1 2 7 3 4 8 5 Figure 18: System Browser Workspace Name Description 1 Views List box Allows you to select the view of the system by clicking the dropdown arrow. 2 Search List box Allows you to search for objects in the currently selected view. You can perform searches on either names or descriptions but not on a combination of both names and descriptions. The box consists of an editable field where you enter search strings, including wildcards.
3 Operating Reference System Manager 5 System browser tree Displays system objects in a hierarchy. 6 Filtering icon Displays the Filtering Search area, where you can limit your search. You filter the objects by selecting individual or multiple building control disciplines, subdisciplines, types, subtypes, and aliases (which are case sensitive). Additionally, the Other dropdown list box allows you to filter for out of scan, override protection, and validation profile settings.
Operating Reference System Manager 3.1.3.1 3 Textual Viewer Workspace Textual Viewer Workspace A6V10415471_en_a_40 Name Description 1 Object Displays a list of objects in the system. A bolded object indicates a parent object with associated children objects. 2 Title bar Displays the name of the object with the primary selection. If you select multiple objects, the name of the first object you selected will display.
3 Operating Reference System Manager 3.1.3.2 Customize Columns Dialog Box 2 1 3 4 Name Description 1 Available Columns Displays a list of columns not currently shown in Textual Viewer. 2 Movement arrows Allow you to move columns to control whether they are hidden or shown. 3 Visible Columns Displays a list of columns that will show in Textual Viewer. 4 Selection buttons Move Up/Move Down: Allow you to rearrange the order in which columns display.
Operating Reference System Manager 3 Operation Workspace 1 Name Description Property name Displays the name of one or more properties associated with the selected objects. If you select multiple objects of the same type in the system, the icon next to the property name indicates this with a triangular symbol in the lower right-hand corner. Clicking this symbol expands the table row to show all of the selected objects of the same type that share this property.
3 Operating Reference System Manager 4 Command button Displays the name of a command that you can initiate. Some commands are sent immediately after you initiate them by releasing the command button. Others require you to enter arguments before they can be sent. When a command requires arguments (additional fields requiring information to continue with the command), the property row will expand after you click the command button.
Operating Reference System Manager 3 Commanding a property is also useful under these conditions: ● User action is required to manage an emergency ● When an alarm indicates a malfunctioning device ● When performing preventive maintenance ● To save energy ● When managing operating hours totalization Example of Commanding At your facility, you want to change the temperature from 68 to 73°F (20 to 22.78°C) in a conference room on your floor.
3 Operating Reference System Manager 3.1.4.4 13 Available 14 Available 15 Available 16 Available Summary Status In order to simplify the system display and highlight the most important information, the system sometimes combines properties into a single Summary Status property. The Summary Status property displays the highest priority status that is currently active for an object.
Operating Reference System Manager 3 3.1.5 Related Items This section provides reference and background information for objects that are related to system objects. For procedures or workflows, see the step-by-step [➙ 32] section. 3.1.5.1 Overview of Related Items The Related Items tab displays objects related to the currently selected object. Each related item is assigned a group name that represents the type of the object—for example, graphics, trends, reports, or schedules.
3 Operating Reference System Manager Navigation You can navigate to a view of each related item by clicking on the item. For instance, if you click a management station object, such as a graphic, Graphics Viewer displays the referenced graphic object. If you click an external item, such as a PDF file, Adobe Reader opens with the referenced file displayed. Other items that you can access include point types, Word documents, Excel documents, and URLs.
Operating Reference System Manager 3.1.5.2 3 Related Items Workspace Related Items allows you to switch between small images and text views of the items in the list, or between categories and flat-list views. Related Items Items Workspace 1 Name Description Links/Icons buttons Clicking the Links button displays items as text links. The display mode that is currently selected in System Browser determines how text displays.
3 Operating Reference Graphics Viewer 3.2 Graphics Viewer This section provides background information for displaying, view, and command graphics in your facility. For related procedures or workflows, see the step-by-step section. 3.2.1 Graphics Viewer Overview The Graphics Viewer is the component of the Graphics application that allows you to view the graphics representing your facility or equipment.
Operating Reference Graphics Viewer 3 the monitoring object. For example, if the monitoring object is a camera, the heading displays Camera in the Related Items tab. Graphics Related Folders Graphics related folders are displayed in the Application View and Management View of the System Browser. Existing graphics associated with your project are listed and viewed from the Application View tree, under the Graphics application.
3 Operating Reference Graphics Viewer If you click a Symbol on a graphic or, the referenced object of the Symbol becomes the secondary selection, while the primary selection remains the same in System Browser. The following figure illustrates the primary selection in System Browser, Analog Output 1. In the Graphics Viewer, the Operation tab changes its display to correspond to the new, secondary selection. System Browser displays the original, primary selection, to show your starting point.
Operating Reference Graphics Viewer 3 When you select an object from System Browser that is associated with a graphic, the Graphics Viewer displays the representative graphic and the object’s associated Symbol on the graphic is selected. As a result, the Operation tab displays the object properties to correspond to the selection. Double-clicking a Symbol on a graphic makes the referenced object associated with the Symbol the primary selection in System Browser and all workflows update accordingly.
3 Operating Reference Graphics Viewer Point Centered Display Mode Point Centered Display mode ensures that a selected data point or group of data points will always be centered in the Graphics Viewer. For example, you might be required to put a data point in this mode if you are monitoring a fire system in a chemical manufacturing facility with key sensors that must always be viewed.
Operating Reference Graphics Viewer 3 Security and the Graphics Viewer Access levels are the security rights users are granted to access applications and objects in the Desigo CC software. The access levels for the Graphics Viewer, Graphics Editor, and Graphics Library Browser are as follows: Graphics Viewer The access rights for the Graphics Viewer application define the user’s ability to display a graphic or a symbol in the Graphics Viewer and in the Graphics Editor Runtime mode.
3 Operating Reference Graphics Viewer ● Non-engineered elements: The connection point aligns itself to the center of the element. ● Symbols: The connection point aligns itself to the center of the first element in the symbol, according to the element tree. ● Customized Connection Point: You can create a connection point location by drawing an ellipse where you want to anchor the connection point for the symbol.
Operating Reference Graphics Viewer 3 Zooming and Panning The Graphics Viewer supports zooming and panning within the active graphic. Zooming allows you to magnify or reduce the graphic image, and panning allows you to move the graphic around on the canvas. In Zooming mode, you can click and drag a rubber band rectangle around any area of the graphic. The rectangle represents the area that will be zoomed to full view once you release the mouse button.
3 Operating Reference Graphics Viewer Fit to Secondary Selection Allows you to calculate the depth and the viewport from the current selection. Depths Navigation View Switches between Depths Navigation view being visible or hidden in the Graphics Viewer area. This view allows you to view a graphic content by depth, and by layer, or by discipline associated with a layer. Show Status and Commands pane Allows you to enable or disable the Status and Commands window from displaying.
Operating Reference Graphics Viewer 3 PLUS SIGN Zoom In (+20%) Z-key Activates Quick Zoom mode. Cursor changes to the magnifying glass and allows you to draw a viewport directly on the active graphic. The previous tool mode is restored when the key is released. F5 Refresh. All views are refreshed. All open graphics are reloaded.
3 Operating Reference Graphics Viewer 5 Argument area and Progress/Result area When you initiate a command that requires additional arguments, the required argument fields display for you to enter one or more arguments prior to sending the command. You must complete all required arguments before sending the command. An argument field that displays a red border around it means that the value for that property is invalid. You will need to enter a valid value before commanding the property.
Operating Reference Graphics Viewer 6 Command area 3 Displays the name of a command that you can initiate. If a command button has a triangle in the lower right-hand corner, the command has multiple buttons or options, and clicking on the triangle displays the options. Some commands are sent immediately after you initiate them by clicking on the Command button. Others require you to enter arguments before they can be sent.
3 Operating Reference Graphics Viewer Views The Graphics Viewer provides you with two floating views, the Aerial View and the Graphic Navigation View, to help you navigate the active graphic. Both views can be resized and toggled to display or not, using the Graphics Viewer toolbar. Aerial View The Aerial View provides you with a bird’s-eye view of the active graphic at all times.
Operating Reference Alarms 3 Navigation View Name Description 1 Selected Depth Displays the active depth. Use the drop-down menu to select from a list of available depths. 2 Filtering Allows you to select how to filter the layers associated with the selected depth. You can filter the layers by Discipline or by Layers. 3 Discipline Selection Displays the discipline used to filter the associated layers with. Use the drop-down menu to choose from a list of available disciplines.
3 Operating Reference Alarms Methods of Handling an Event ● ● ● Fast treatment. You can view information about events and send eventhandling commands from directly inside Event List. This is the most straightforward method of handling an event. You can also send commands in the same way from the Event Detail bar, where available. For instructions, see Handling Events from Event List [➙ 40]. Investigative treatment.
Operating Reference Alarms 3 The event-handling comment that explains the reason for the action is recorded and stored in the Detail Log tab. Auto-Event Handling Desigo CC can be configured to automatically start the handling of certain events when specified conditions occur on the site. In this case, certain actions such as opening Event List or selecting the event might happen automatically, so you will not need to do them manually.
3 Operating Reference Alarms When the Summary bar is collapsed to a slim bar, event information appears in a reduced format (event category abbreviation and the total number of events for that category), including also icons for any event timers or applied filters. Figure 19: Event Lamp in Collapsed (Slim) Summary Bar 2 1 3 Figure 20: Event Lamp in Expanded Summary Bar 1 Background color Indicates the category color of the event. The specific category colors employed are dependent on the event schema.
Operating Reference Alarms 3 Solid category color and not flashing. There are no unprocessed events for that category. NOTE: In Client Profiles where recurring events [➙ 225] are grouped under a parent container, the event lamp stops flashing when there are no unprocessed events in the event container. Solid dark category color and not flashing. Filter by category activated. There are no unprocessed events for that category.
3 Operating Reference Alarms Event List Workspace 1 2 3 4 5 6 1 Summary bar Contains a set of event lamps that provide an overview of the events in the system. For more details, see Event Lamps [➙ 207] and Summary Bar [➙ 11]. 2 Event Detail bar In some configurations, prominently displays an event that requires immediate attention across the top of the screen.
Operating Reference Alarms 6 Contextual pane 3 Hidden by default. When open, it provides additional information, actions, and resources about the object that issued the event. The following tabs are available: ● Operation/Extended Operation: Lets you inspect all the properties of the event source, and view and execute any commands/actions available for that object.
3 Operating Reference Alarms 3 Title bar Shows the name of the Investigative Treatment window. It also contains some icons to open/close the Contextual pane (7), lock the layout and, restore down the window. 4 Event descriptor Contains the event button, event details and event-handling commands for the event currently being processed. For more details, see the reference [➙ 215] section. The background color reflects the event category color, but in a darker shade.
Operating Reference Alarms 3 1 Summary bar Contains a set of event lamps that provide an overview of the events in the system. For more details, see Event Lamps [➙ 207] and Summary Bar [➙ 11]. 2 Event Detail bar In some configurations, prominently displays an event that requires immediate attention across the top of the screen. 3 Title bar Shows the name of the Assisted Treatment window.
3 Operating Reference Alarms 1 4 5 2 6 3 1 Symbol that indicates a mandatory step. 2 Step identifier. This number may or may not correspond to the execution order. 3 Briefly describes the step type.
Operating Reference Alarms 3 ● Whether the steps must be executed sequentially, or may instead be freely executed in any order, depends on how the assisted-procedure was configured. ● When you move your cursor over a step during the execution of an assisted procedure: – If it turns into hand, this means that you can execute the step. – If it turns into arrow, this means that you cannot execute the step because it is locked.
3 Operating Reference Alarms ● Any changes you make to the columns in Event List will also apply to the Event Detail bar and to the Investigative Treatment and Assisted Treatment windows. ● Changes to column settings will be automatically saved when you exit the Desigo CC client application, and so will persist across sessions. Note that column settings are specific to the user profile. This means that different users can have different column settings.
Operating Reference Alarms 3 Source Indicates the object that issued the event. Whether the source name or description displays depends on the current display mode. For instructions, see Setting How Objects are Labeled in System Manager. For workstation-based alarms, [object name].[property name] displays in this column. How driver-based alarms display - [object name] or [object name].[property name]) - depends on the specific driver.
3 Operating Reference Alarms intervention text may or may not be available to you. For instructions, see Get More Information About the Event [➙ 42]. ● (start investigative treatment) or (start assisted treatment). For instructions, see Start Investigative Treatment [➙ 44] and Start Assisted Treatment [➙ 47]. You cannot resize Information column. Event Status Describes the status of the event [➙ 222]. For example: Unprocessed, Ready to be reset, and so on.
Operating Reference Alarms 3 Discipline Describes the discipline to which the event belongs. Icon Discipline Building Automation Building Infrastructure Energy Management Fire Management System Notification Security Tag Lets you to tag/untag events [➙ 61], so that you can selectively show/hide them in Event List. This button will be visible but inactive in the Event Detail bar, and the Tag column will not appear in investigative/assisted treatment. 3.3.
3 Operating Reference Alarms 4 5 Bar along the righthand side of the button Suggested action icon1) The background color indicates the source status, whether the event source is: ● Active (bar matches the background color). ● Quiet (bar is gray). Next action to be taken. For more details, see Event Status and Suggested Action [➙ 222].
Operating Reference Alarms 3 3.3.8 Event-Handling Commands Command Description Notes Acknowledge the event Available when event status = Unprocessed and suggested action = Acknowledge event. Reset the event In fast/investigative treatment: available when event status = Ready to be closed and suggested action = Close event. In assisted treatment: available when event status = Ready to be reset and suggested action = Reset event. Close the event Only for assisted treatment.
3 Operating Reference Alarms 3.3.9 Event Status and Suggested Action Event Status Suggested Action Icon in event button Fast / Investigative Assisted Treatment Treatment Unprocessed Acknowledge event The event is new and still unprocessed. This means that you either did not yet select the event, or that you selected it but did not acknowledge it yet. Ready to be reset Reset event Not applicable In assisted treatment, you selected an event and the source status is back in normal condition.
Operating Reference Alarms 3 Fast/Investigative Treatment Workflow Acknowledgment Model Scenario Event Status ACK and Reset required ● Event handling started (and at least one event-handling command sent) Unprocessed ● Event source back to Quiet Waiting for condition Ready to be closed Closed No Reset (ACK only required) No ACK, No Reset Optional ACK, No Reset ● Event handling not started yet (no event-handling command sent yet) ● Event source back to Quiet ● Event handling started (and
3 Operating Reference Alarms ● ● Event handling not started yet (and no event-handling command sent yet) Event source back to Quiet Unprocessed Waiting for condition (due to mandatory steps) Ready to be closed Closed No ACK, No Reset ● Event handling started (and at least Waiting for one event-handling command sent) condition ● Event source back to Quiet Waiting for condition (due to mandatory steps) Ready to be closed Closed ● Event handling not started yet (and no event-handling command sent
Operating Reference Alarms No ACK, No Reset ● ● Optional ACK, No Reset 3 Event handling started (and at least Waiting for one event-handling command sent) condition or not started yet (and no command Ready to be closed sent yet) Closed Event source back to Quiet ● Event handling started (and at least one event-handling command sent) ● Event source back to Quiet Unprocessed Waiting for condition Ready to be closed Closed ● ● 3.3.
3 Operating Reference Scheduling Tags and Filters Applied to Recurring Events When you apply tags or filters to Event List: ● Tagging/untagging a parent event affects all its child recurrences. ● You can also separately tag/untag an individual child recurrence. ● If you tag a recurring event (parent plus all its children) and apply a Hide tagged events filter, a new recurrence of that event will cause only the parent event to display again, along with the new recurrence.
Operating Reference Scheduling 3 This section provides background information on Schedules of Desigo CC. For related procedures, see the step-by-step section. 3.4.1 BACnet Schedules You use BACnet scheduling to automatically command points at prescribed time intervals. You can create daily or weekly schedules for BACnet field panels. Each BACnet panel stores its own calendar and schedule objects, and a BACnet panel can store and run multiple calendars or schedules at the same time.
3 Operating Reference Scheduling Name Description 1 Schedule Name Displays the name of the schedule. 2 Scheduler Toolbar Includes the following icons: New: Opens a New BACnet Schedule, New Management Station Schedule, New BACnet Calendar, New Management Station Calendar, or New BACnet Command Table. Save: Saves the schedule to the system. Save As: Allows you to save another instance of the schedule with a different name and description. Delete: Deletes the schedule from the system.
Operating Reference Scheduling 5 Schedule 3 When first displayed or refreshed, the current day is selected by default. Day tab: Displays a schedule for the day selected in the Date Picker. Selecting the Detail check box reveals calendar entries, weekly schedule entries, and exception schedule entries. The Day tab also displays a horizontal time bar indicating the current time. Week tab: Displays the weekly schedule. You can click any day of the week to view details.
3 Operating Reference Scheduling BACnet Command Workspace This section provides an overview of the BACnet Command workspace. Name Description 1 New Button Opens a new command table. 2 Scheduler Toolbar Includes the following icons: New: Opens a New BACnet Schedule, New Management Station Schedule, New BACnet Calendar, New Management Station Calendar, New BACnet Command Table, or New Management Station trigger. Save: Saves the command object to the system.
Operating Reference Scheduling 3 station schedules can process both BACnet and non-BACnet object types (BACnet schedules process only BACnet object types). You can also create exceptions to schedules. When a management station exception is ON, it overrides the weekly schedule. When the exception is OFF, control returns to the weekly schedule. Values are displayed as per value scaled units (if configured). For more information, see Value Scale Units.
3 Operating Reference Scheduling In this example, the Active status of the schedule set at 6 p.m. continues till 9 a.m. the next day. There is no change of value at midnight because the active status continues as it finds the same active entry at 12.00 a.m. midnight. Example 2: Active Value: 50, Inactive Value: 60: Time period for the schedule (Active: 9:00 a.m., Inactive: 6:00 p.m.
Operating Reference Scheduling 3 In this example, the Inactive status of the schedule set at 6 p.m. continues till 9 a.m. the next day. There is no change of value at midnight. This is because the Inactive status continues as it does not find an Active entry at 12.00 a.m. midnight. If there is no entry post mid night, then it is by default considered as an Inactive state. However, if the Inactive state is to be discontinued then an Active entry is to be added at midnight.
3 Operating Reference Scheduling Daily Management Station Schedule You can create a daily schedule from the Sub-Type drop down list in the Setup tab and specify either similar active or inactive values for all days of the week or different values for individual days from the Schedule Entries tab. The daily schedules are treated as single day schedules that are valid till 11.59 PM. Post mid-night the next day's daily schedule is functional.
Operating Reference Scheduling 4 5 3 6 1 2 3 A6V10415471_en_a_40 235 | 352
3 Operating Reference Scheduling Name Description 1 Schedule Name Displays the name of the schedule. 2 Scheduler Toolbar Includes the following icons: New: Opens a New BACnet Schedule, New Management Station Schedule, New BACnet Calendar, New Management Station Calendar, or New BACnet Command Table. Save: Saves the schedule to the system. Save As: Allows you to save another instance of the schedule with a different name and description. Delete: Deletes the schedule from the system.
Operating Reference Scheduling 3 Management Station Calendar Workspace This section provides an overview of the Management Station Calendar Workspace. Calendars allow you to override scheduled switch commands. In this sense, you can consider calendars as exception schedules, consisting of dates only. When you create a calendar, you can choose specific dates (January 15), a date range (August 1 – 31), or a week and a day you want the exception to run (third week of the month, on Wednesday).
3 Operating Reference Scheduling 3.4.3 Timeline Viewer Timeline Viewer allows you to view the details of multiple management station and field panel schedules simultaneously, spanning a range of time. To do this, System Manager must be in Operating mode. Timeline Viewer Workspace This section provides an overview of the Timeline Viewer Workspace. Name Description 1 Time Range Scrollbar Allows you to control the date range of schedules.
Operating Reference Scheduling 3 Preset Time Periods You can click the Zoom to Preset Time Period icon on the Timeline Viewer toolbar to select how much of the timeline is visible at once. The choices are 12 hours, 1 day, 3 days, 1 week, 2 weeks, or 1 month. The Timeline Viewer accepts a maximum of 50 schedules. The fewer schedules you view, the more options you have with the preset time periods. The more schedules you view, the fewer options you have with the preset time periods.
3 Operating Reference Reports 3.5 Reports The main function of the reports application in Desigo CC is to collect data from the runtime system and allow you to present this data in a customized manner. This section provides background information on Reports of Desigo CC . For related procedures, see the step-by-step section. 3.5.1 Overview of Reports A report is a formatted and organized presentation of data.
Operating Reference Reports 3 The properties applicable to an object type can be displayed as columns in the Objects table by setting the appropriate display levels in the Properties expander in the Models and Functions tab. In the following screenshot, the AlarmFault and Alarm.OffNormal properties cannot display as table columns since their display levels are not set.
3 Operating Reference Reports Constraints The following constraints apply to the Activities report.
Operating Reference Reports ● ● ● 3 When you add a Condition filter to the Activities table, you cannot apply the OR operator between two filter expressions that are located on two different columns. You can apply the OR operator between two filter expressions set on the same column. You cannot apply the NOT operator in the Condition filter for an Activities table. For example, NOT 'Action' = "Add Camera" is invalid.
3 Operating Reference Reports Observer Name Observer Designation Observer Location Observer Identifier (Internal) Alias [Object] Alias [Observer] ● ● ● When you add a Condition filter to the Event Details table, you cannot apply the OR operator between two filter expressions located on two different columns.
Operating Reference Reports 3 Observer Identifier (Internal) Alias [Object] Alias [Observer] Unit ● ● ● When you add a Condition filter to the Event Details table, you cannot apply the OR operator between two filter expressions set on two different columns. You can apply the OR operator between two filter expressions set on the same column.
3 Operating Reference Reports ● ● ● ● When you add a Condition filter to the All Logs table, you cannot apply the OR operator between two filter expressions set on two different columns. You can apply the OR operator between two filter expressions set on the same column. To apply the OR operator on the same column, select the column and the operator, press SHIFT or CTRL, depending on whether you want to select values listed next to each other or away from each other, and then click Add.
Operating Reference Reports 3 3.5.2 Reports Workspace This section gives an overview of the Reports workspace. 2 3 4 1 5 6 7 Reports Workspace 3.5.2.1 Name Description 1 System Browser Displays all the saved Report Definitions in Application View > Applications > Reports. 2 Reports Toolbar [➙ 247] Contains icons for performing various actions in Reports. Reports toolbar for operating procedures - Displays only when the report is executed for a selected event from Assisted Treatment.
3 Operating Reference Reports Save Saves the configuration of the currently selected Report Definition or saves a newly created and configured Report Definition. NOTE: This command is dimmed until you modify the current Report Definition. Save As Saves the configuration of the currently selected Report Definition as a new Report Definition, or saves a newly created and configured Report Definition. Save as Default Saves the selected Report Definition as the default report template.
Operating Reference Reports Import 3 Imports the Report Definitions and logos. The Import icon is enabled only when the Report folder is selected in System Browser. Reports Toolbar For Operating Procedures 3.5.2.2 Save User Input Saves the Event Treatment-related information you entered in the report for operating procedures, when it is executed for a selected event from Assisted Treatment. You can view the saved information if you re-select the same step in the same event.
3 Operating Reference Reports Table Summary Table Type Default Columns Objects Table ● and its extensions: Schedule and Related Items Default columns displayed are: - Object Description - Object Designation - Function - Discipline - Subdiscipline - Type - Subtype - Main Value ● Columns specific to scheduling objects are: - Weekly schedule - Exceptions - Commanded objects - Effective Period ● Columns specific to Related Items objects are: - Related Items - Related Items Type Additional Columns Sup
Operating Reference Reports Active Events A6V10415471_en_a_40 ● Category ● Cause ● State ● Object Designation ● Object Description ● Discipline ● Subdiscipline ● Creation Date Time ● Object Property ● Source Status ● Supports the following additional columns - Alias - Available Commands - Customer Text - Event ID - Event Status Text - In process by - Intervention Text - Is Maintenance - Location - Name - Object Designation [Application View] - Object Designation [Current View] - Obje
3 Operating Reference Reports Activities 252 | 352 ● Source Time ● Object Description ● Object Designation ● Action ● Log Type ● Previous Value ● Value ● Status ● User Name ● Management Station ● Message Text ● Attachment ● Supports the following additional columns - Alias [Associated Object] - Alias [Object] - Associated Object Description - Associated Object Designation - Associated Object Location - Associated Object Name - Associated Object Name [Internal] - Discipline - DPE
Operating Reference Reports Events A6V10415471_en_a_40 ● Event Time ● Event State ● Event Category ● Event Cause ● Event ID ● Object Description ● Object Designation ● User Name ● Supports the following additional columns - Alias [Object] - Alias [Observer] - Discipline - DPEObserver - Event Message Text - Event Mode - Event Source - Event Value - Event Went - Event Details - Category Priority - Object Designation [Application View] - Object Designation [Current View] - Object Designatio
3 Operating Reference Reports Event Details 254 | 352 ● Default columns displayed in the Parent table are: - Event Time - Event Category - Event Cause - Event ID - Object Description - Object Designation ● Supports the following additional columns - Alias [Object] - Alias [Observer] - Discipline - DPEObserver - Event Message Text - Event Mode - Event Source - Event Value - Event Went - Event Details - Category Priority - Object Designation [Application View] - Object Designation [Current View] - Obje
Operating Reference Reports BACnet Event ● Information Event Stamp Fault ● Event Enable ● Acked Transitions ● Device Description ● Event Stamp OffNormal ● Event Stamp Normal ● Event Priority OffNormal ● Notify Type ● Alarm State ● Object Id ● Event Priority Normal BACnet Alam Summary BACnet Enrollment Summary A6V10415471_en_a_40 3 ● ● Supports only the Name and Row filter.
3 Operating Reference Reports Trends 256 | 352 ● DateTime ● Value ● Unit ● Quality ● Supports the following additional columns - Validation Profile - Object Version ● Supports the Name filter, Condition filter, Time filter, and Row filter. However, the Condition filter is not supported on the Object Version and Validation Profile columns. ● Does not support multiple Name filters. ● Sorting is possible only on the DateTime column.
Operating Reference Reports All Logs A6V10415471_en_a_40 ● Event Category ● Log Type ● Event ID ● Event Time ● Previous Value ● Event Message Text ● Quality ● Date/Time ● Record Type ● Event Cause ● Event State ● Previous Quality ● Source Description ● Action ● Source Property ● Value ● Unit ● Supports the following additional columns - Action Details - Action Result - Alert ID - Alias [Observer] - Alias [Source] - Attachment - Discipline - Event Mode - Event Details -
3 Operating Reference Reports Orphans Orphan Activities Orphan Events Orphan Trends 258 | 352 ● Orphan Type ● Object Identifier ● Object Location ● Object Property ● Source Time ● Object Identifier ● Object Designation ● Object Property ● Log Type ● Action ● Status ● Previous Value Text ● Value Text ● User Name ● Management Station ● Message Text ● Event Time ● Object Identifier ● Event State ● Event Category ● Event Cause ● Event ID ● Object Designation
Operating Reference Reports 3 Select Columns Dialog Box When you add a table to a report, you can add, remove, or delete columns from the Select Columns dialog box. Select Columns Dialog Box Components Description A6V10415471_en_a_40 Parent tab Allows you to add, remove, or reorder Parent columns in the table. Object Type (Displays only for a Point table) Lists the object collection.
3 Operating Reference Reports Clear All Unchecks all columns except mandatory columns. The Selected Columns list displays only mandatory columns. Move Up Moves the selected column one step up in the Selected Columns list. The Move Up button is unavailable if you select the column on the top. Move Down Moves the selected column one step down in the Selected Columns list. The Move Down button is unavailable if you select the column at bottom.
Operating Reference Reports 3 Keyword Group Box Keywords are pre-defined templates that can be added anywhere in a Report Definition. They are replaced with actual data in Run mode and when the report document (PDF, XLS) is created. There are two types of keywords: ● Content-specific, which can be inserted only above tables/plots. For example, content-specific keywords, such as Content Type, Name filter or Record Count, cannot be inserted in the header/footer section of a Report Definition.
3 Operating Reference Reports Generic Keyword List Generic Keywords Description DATE Displays the Date (format is location-dependent) TIME Displays the Time (format is location-dependent) PAGE Displays the page number when the report document (PDF) is created. PAGES Displays the total number of pages when the report document (PDF) is created.
Operating Reference Reports 3 Components of Manage Logo Dialog Box Description Select logo to upload Displays selected image file path. Browse Opens the Windows Open dialog box. Upload Adds a new Logo to the Available Logos list. NOTE: The Upload button remains unavailable until a valid path and file name is selected. Thumbnail Displays the thumbnail view of an image. Logo name Saves as Logo name. The Logo name must be unique. Delete Deletes selected logos.
3 Operating Reference Reports Editable Field Use the Editable Field control, to enter text in Run mode. This field does not support keywords. Custom Text Selection The Custom Text Selection control provides a drop-down list that enables you to add, modify, and delete text entries in Edit mode and select entries in Run mode. Components of the Custom Text Selection Control Icon Name Description Add Adds the text entered to the control. NOTE: Available only when some text is entered.
Operating Reference Reports 3 Unlike other tables, the columns in this table are fixed and you cannot perform column operations like adding, deleting, reordering, and sorting. Also, this table does not support filtering. Figure 21: View Group Box The View group box provides the following options that determine the visibility of a report on the screen. ● Page Width Adjusts the width of a report page to use all the available width of the Reports workspace.
3 Operating Reference Reports 3.5.2.3 Filter Tab The Filter tab allows you to define and apply different filters for data retrieval. Name Filter The Name filter allows you to filter data based on the Name or Description of System Browser objects. You can apply a Name filter to a table or plot.
Operating Reference Reports 3 Name Filter Displays the filter that is currently selected in the Name Filter list. You can type a name into this field. The valid format for entering a Name filter is SystemName.ViewName:Hierarchy.*, where.* is for displaying the child nodes of the selected object. For example, System1.Application View.Site.Building.Floor1.* NOTE: For a plot, you can set only one Name filter at a time. Validate Checks whether the applied filter is valid or not.
3 Operating Reference Reports Wildcard Characters in Name Filters (For Distributed Systems) ● To display the details of all the Analog Output objects of all system devices present in all the configured systems in a distributed environment, specify the following Name filter in the report definition, “*.ManagementView:ManagementView.FieldNetworks.*.AO*”.
Operating Reference Reports 3 Condition Filter Syntax When you are creating a Condition filter, you must know the data type of the property for which you want to apply the filter. Following are some examples which will help you create Condition filters without syntax errors. 1. If property displays text data, for example string or enumeration, then the value must be enclosed within double quotes.
3 Operating Reference Reports Condition Filter Dialog Box Components 270 | 352 Field Description Type filter Displays only when an Objects table is selected in the Report Definition. Allows you to enter the object type description on which you want to filter the object types to be displayed in the Type drop-down list. For example, if you want the Type drop-down list to display all BACnet object types, enter BACnet as the type filter.
Operating Reference Reports Available columns 1) 3 Lists all the available columns of a selected table. For an Objects table, the columns corresponding to the object type selected in Type are listed. In case of the Objects table, displays the following information: ● Common columns applicable to any type of object. These are listed at the top of the list. For example, Discipline, Object Name, Object Description, and so on. ● Columns referring to properties supported by the selected object type.
3 Operating Reference Reports Time Filter Dialog Box Components Field Description Date time specification Shows LOCAL, when the Date/Time in UTC format check box on the Home tab is not selected. Select Column Displays only when an Events, All Logs, or Activities table is selected in the Report Definition. The entries in the drop-down list depend on table selected and allow you to filter information accordingly.
Operating Reference Reports 3 Custom The Custom option allows you to set the date and time as per your requirement. Selecting the Custom option enables the From/To field. The To date should always be greater than From date. If the To date is less than the From date, then the To field is highlighted in red and an error message displays on mouse-over. The From and To date should be same as the date already set in Short date on your management station.
3 Operating Reference Reports Page Setup Group Box The Page Setup group box allows you to set the orientation, page size, and margin of the Report Definition. Orientation The Orientation menu contains two submenus: ● Portrait: long vertical edge ● Landscape: long horizontal edge (default) Page Size The Page Size menu contains several pre-configured sizes including: A3, A4, A5, Letter, and so on. The default page size is A4.
Operating Reference Reports 3 Figure 22: Position Group Box Alignment Refers to the placement of objects or layout elements on the report page. The different alignments are: Left, Center, and Right. Indentation Allows you to set the distance between the report page margin and the actual placement of the element. Spacing Allows you to set the space before and after the layout elements. Width Allows you to adjust the width of a layout element (logo and plot only).
3 Operating Reference Reports 3.5.2.5 Data Tab The Data tab allows you to specify the location from which the data is to be retrieved when you run the report. It also provides the option to define the Graphics filter. If you have selected any of the options from the Table group box, the same option is also selected in the Condition Filter dialog box. Any change in selection reflects in the Condition Filter dialog box as well.
Operating Reference Reports A6V10415471_en_a_40 3 277 | 352
3 Operating Reference Reports Report Output Definition Dialog Box Components Field Description Report format Lists the following supported file formats. PDF [➙ 279] Excel [➙ 279] CSV XML – This format is available only if you have the relevant license. NOTE 1: According to the EMC requirement, the CSV report format is supported to export a Trends report in the CSV format. The EMC proxies have plug-ins that support converting data from CVS formats for import into EMC.
Operating Reference Reports 3 PDF Report Format After executing a Report Definition manually or automatically, you can view and save the report as a PDF document. A PDF document contains all the report elements of the Report Definition with output data and sorting applied. It also displays the special formatting applied to Report Definition elements (such as tables, plots, keywords, and so on).
3 Operating Reference Reports the report, and then generate the Excel document, only the parent records display and the columns display a combo box that enables you to perform data analysis. In order to perform analysis on a specific set of columns in a table, you can add a PivotTable or chart to the generated Excel document and set this document as a template to the report definition having this table.
Operating Reference Reports 3 In case of a distributed system, the process of generating the PDF or XLS documents will stop if you switch over to a different system. During this process, if the document is likely to be split into multiple documents, then the pending documents will not be available. You can decide whether you want to proceed with the document generation process by confirming to the dialog box options that display when you switch over to a different system.
3 Operating Reference Reports Report Output Folders Configuration Components 282 | 352 Field Description Folder Alias Displays the name of the destination folder. When you select File in the Destination Type field, this name will be displayed in the File drop-down list of the Destination list of the Report Output Definition dialog box. Folder Path Displays the folder path that you have selected using the Browse button. You can configure a maximum of 100 folder paths.
Operating Reference Reports 3 Destination Type - Email The Report Output Definition dialog box allows you to send a report via email. You can send all documents in one mail or configure the number of documents to be sent per email. The default is one document per email. Before sending an email you must configure the mail server. The Email Contacts dialog box displays when you select the destination type as Email and then click the Select Contacts button.
3 Operating Reference Reports Email Contacts Dialog Box Components Field Description Contacts selection Shows the names of the configured contacts in the Address Book followed by their email address in brackets. This list is sorted alphabetically. NOTE: A recipient may have up to three different email addresses configured. Filter List Entries Allows you to type in a filter. For example, if you type the letter “A”, the recipient list displays all the contacts starting with the letter A.
Operating Reference Reports 3 Action Result A recipient email address is changed in the Address Book The new email address reflects in the Output Definition list in the Report Output Definition dialog box and Contacts section list in the Email Contacts dialog box. A listed email address of the configured The list of email addresses in the Output Definition list in the contact is deleted in the Address Book Report Output Definition dialog box displays in red.
3 Operating Reference Reports 3.5.2.7 Report Management Section The Report Management section displays the Report execution status, such as PDF/XLS document creation status, during Report execution. The Report execution/generation mode is called Run mode. It also provides quick and easy navigation to different Report snapshots. When you select a snapshot in the Report Management section, it displays in Reports.
Operating Reference Reports 3 You can also monitor the PDF/XLS document creation progress and stop it by using the Stop button. However, if you stop the PDF/XLS document creation when it is in progress, the consecutive split document creation will also be stopped. You can delete the split document by using the Delete button or all the documents by deleting the Report snapshot entry. The entry of each split document in a Report Management section is a child of the entry for the Report snapshot.
3 Operating Reference Reports objects are set as Name filters for the Objects table (no graphics plot, trends plot). You can then configure and run this report as usual. Related Report If the selected System Browser object is defined as a Name filter in a report, then this report becomes a related report for that object and displays as a link/icon in the Related Items tab. On clicking this link/icon, the related report runs.
Operating Reference Reports 3 Run Mode The Run mode executes a Report Definition and displays the data retrieved from Reports and other services. Following are the characteristics of the Run mode: ● The ribbon disappears. ● Keywords are replaced by actual data. ● No element can be added or deleted in this mode. ● The layout elements are populated with data. ● You can perform the following activities: – Sorting (ascending or descending) or changing column width. – Selecting rows in tables.
3 Operating Reference Reports 3.5.
Operating Reference Reports 3 Secondary Pane If the Primary pane is unlocked (horizontal pushpin icon ), then you can work with the following three additional report types in the Secondary pane: ● ● New Report: Opens a new Report Definition for configuration. Related Report: Opens the report related to the selected System Browser object. Show in Related Items Report: Opens a report with the Show in Related Items check box selected.
3 Operating Reference Trends Name Description 1 Report Defintion Selection Location of Report Definitions and Report folders in the Application View of System Browser. 2 Automatic report execution Runs a Report Definition in the background. 3 Report Definition Properties Properties (Last Run, Summary Status, and Show in Related Items) displayed in the Extended Operations tab. 3.6 Trends The Trends application allows you to work with trends that are recurring samples of data.
Operating Reference Trends Time interval based 1 70.8°F 2 70.3°F 3 70.8°F 3 4 72.5°F Room temperature Interval 73.0°F 72.0°F 71.0°F 70.0°F COV based = 1.0 ● 1 70.0°F 2 71.0°F 3 72.0°F 4 71.0°F 5 72.0°F 6 71.0°F Triggered Refers to the BACnet reference names of the selected trigger from reaction, scheduler or the BACnet reference.
Operating Reference 3 Trends 1 3 2 5 4 Trends Workspace Name Description 1 System Browser Displays available Trendlog objects, as well as created Trend Views. 2 Configuration toolbar Displays buttons for commonly used commands (New, Save, Print, zoom). 3 Compare view Allows you to compare measured values from the same Trend View. 4 Trend View The range which can be displayed and processed for online and offline trend data in chart form.
Operating Reference Trends 3 Trends Toolbar The Trends toolbar allows you to perform the following operations: A6V10415471_en_a_40 Function Description Edit Trend Toggles between the Edit Trend mode and the View Trend mode. Start Creation Starts creating the trend logs depending on the configuration specified in the Edit Trend mode. New Trend Opens a new Trend View. New Folder Creates a new folder. Delete Deletes the current Trend View. Save Saves the current Trend View.
3 Operating Reference Trends Chart Properties Menu Description Grid Hides/shows the grid for the Trend View or displays it with horizontal or vertical lines. Background Hides/shows the background color as well as pattern for Trend View. Allows you to define or select the background from a predefined set of colors. Titles A descriptive name required for each Trend View. The name entered displays on the Trend View. You can also add your own title to the left and right axis of the Trend View.
Operating Reference Trends 3 NOTE: Automatic/manual scaling properties act on both main and comparative view. Automatic scaling is temporarily disabled when switching to Zoom mode. Legend Properties Menu Description Legend The position can be left, right, above, or below the Trend View. Under a comparison view, the legend always displays on the right. Series Properties Series properties allow you to define the individual series for the corresponding properties in Trend View.
3 Operating Reference Trends Line Properties Line type Line style Stroke color Stroke thickness Marker style 1-6 Marker thickness 1-10 Colors: You can assign a color to the Trend View (background color) or to each individual series (line). You can choose between: ● Predefined set of colors. ● Custom colors. 1 4 2 5 3 6 7 8 9 Colors Workspace Description 1 Select from predefined colors. 2 Select with mouse. 3 Directly enter each color code. 4 Selected color. 5 Enter a color code.
Operating Reference Trends 3 Compare View The Compare View allows you to compare and analyze the data of trended objects over a period of time. The Trend View below the first view is the current Trend View that serves as the basis for the first view which is the compare view. Any changes to the time range in the current Trend View are reflected in the comparative Trend View. You can link the same or another Trend View for data analysis that applies the same X-axis for the time range to both Trend Views.
3 Operating Reference Trends Trend View The Trend View consists of a chart area where series are viewed and manipulated. All the main elements such as the axes, scaling, titles and colors can be configured in Trend View properties (by taking over defaults or changing the current Trend View). 1 2 6 7 3 8 4 9 5 10 11 12 13 14 Trend View Description 1 Displays the title of the current Trend View. 2, 11 Displays and highlights the selected trend curve in Trend View.
Operating Reference Trends 3 Data Point Key Column Description Series source. Indicates if the displayed data is recorded by the management station data (online ) or a field device (offline ). Trended Object Displays the object names for the Trendlog object. Trended Property Displays the trended property name for the object. Alias Displays the alias name for the object. Unit Physical unit for the data point. Value Displays the last displayed current value (unless the time bar is in use.
3 Operating Reference Trends Quality Attributes The Trend View can display a number of state attributes, referred to as quality attributes, along with the trend data. These enable you to identify problems with the data point being recorded, and assist with the diagnosis of plant conditions. With the reduced display, not all quality attributes can be displayed. In order to display all quality attributes, limit the time period.
Operating Reference Trends 3 NOTE: Quality attributes can only be evaluated if this function supports the corresponding subsystem. An alarm setup on the management station does not possess quality attributes. Therefore, an alarm cannot display an alarm bell in the Trend View. Table View The table view offers a view that differs from the standard view where curves are displayed as series. Each series displays as a column in the data grid. The first column (right) shows the time stamp.
3 Operating Reference Trends Edit Trend Mode The Edit Trend mode provides options to operate on multiple BACnet trend log objects in a single click. If you have to create, modify, or delete multiple BACnet trend log objects, then performing this procedure on individual objects requires a huge engineering effort.
Operating Reference Trends 3 Trend Definitions Name Description Trendlog Name Specify a unique name for the trend log object. Device The device on which the trend log object is to be created. While selecting the device, you must ensure the following: 1. The device belongs to the same subsystem as that of the BACnet point selected for the trend log creation. 2.
3 Operating Reference Trends Manual Correction Workspace 3 4 1 2 5 Name Description 1 Manual Correction toolbar Contains buttons for performing various actions on the Manual Correction application. 2 Trended Object Displays the object whose property details are to be modified.. 3 Trended Properties Displays the trended properties of the trended object.
Operating Reference Trends 3 Description Time Date/Time of the property value of the object. Value Value of the trended property of the object. Unit Unit of the trended property Status Displays either of the following values: Good – Value of displayed data is good. Bad – Value of displayed data is bad as per IOWA standards. Added – Displayed value is added by user. Corrected – Displayed value is modified by user. 3.6.
3 Operating Reference Trends Phase 1: Record Offline Trend Data Trend data is saved locally to the Trendlog object in the automation station. 64°F 64°F Automation Station Trend Log Object Phase 2: Upload Offline Trend Data Trend data is uploaded if: Trend DB 64°F ● The maximum buffer size is reached. ● The number of defined entries is reached. ● Manually triggered by the management station.
Operating Reference Trends 3 NOTICE Validated Projects Specific critical environments (for example, pharmaceutical installations and processed) require a high degree of safety and traceability of all operational workflows and user activities. A validated plant can lose its validity or must be revalidated by adding or losing BACnet objects. Therefore, do not use this function, or do not enable it in the application rights. 3.6.
3 Operating Reference Trends Offline Trendlog Objects Offline trend data can be recorded and saved by Trendlog objects within the automation and control system even when the management station is not connected. The recorded data can then be saved in the trend database. Offline trend data can be retrieved and displayed in the trends. Online Trendlog Objects Data recorded by online trending and saved to the trend database (for example, using save continuously) can be retrieved and displayed in the trends.
Operating Reference Log Viewer 3 3.7 Log Viewer The main function of the Log Viewer is to present you the historical data of all system activities and events without having to create and configure a report from the reports application. This section provides background information on Log Viewer. For related procedures, see the step-by-step section. 3.7.
3 Operating Reference Log Viewer NOTE: When you select the Log Viewer root node, a log view folder, or a saved log view definition from System Browser, you may see the following message above the log view table: Configured View Size reached! Refine search via Search Filter. This means that there are more records in the database than can be displayed in the defined view size. In order to view such records you must either specify filters or modify existing filters.
Operating Reference Log Viewer 3 Additional Columns in a Log View Additional Columns A6V10415471_en_a_40 Name Description Action Details Additional descriptive information of the activity performed. Action Result Status of a user activity. Possible values are Succeeded, Partially Succeeded, Failed, Unknown. Attachment Displays the link to the report output document that is created when performing the Operating Procedure Steps such as alarm printout, report, or treatment form.
3 Operating Reference Log Viewer Subdiscipline Subdiscipline of the source object (for example, Communication for management platform discipline). Type Type of the source object (for example, network). Subtype Subtype of the source object (for example, BACnet for type Network). Alert ID Internal unique ID associated with an event. User Name of the user performing the activity or treating the event. Validation Profile Validation profile associated with the source object.
Operating Reference Log Viewer 3 Log Viewer Workspace Name Description 1 System Browser Displays all the saved Log View definitions in Application View > Applications > Log Viewer. 2 Log Viewer toolbar [➙ 315] Contains buttons for performing various actions in Log Viewer. 3 Log View Displays the combined data from the Activity Log and Event Log. By clicking the drop-down arrow, a menu with the following options displays: Hide Column - Hides the column.
3 Operating Reference Log Viewer Revert to Saved Search Returns to the previously applied search filter. Filters [➙ 153] Stop Execution Stops the execution of a log view. Configuration Displays the Configuration dialog box that allows you to perform the following: Print ● Display the date and time values in the log view till milliseconds by selecting the Show DateTime with milliseconds check box. ● Specify the filter language for modifying a search filter.
Operating Reference Log Viewer 3 Select Default Selects the default columns in the Available Columns list. Select All Selects all the columns in the Available Columns list. Clear All Clears all the columns in the Available Columns list. Move Up Moves the selected column one step up in the Selected Columns list. The Move Up button is unavailable if you select the column on the top. Move Down Moves the selected column one step down in the Selected Columns list.
3 Operating Reference Log Viewer List of ENUM columns ● Subtype ● Type ● Subdiscipline ● Discipline ● Record Type ● Action Result ● Event Mode ● Event Category ● Event State ● Log Type ● Action ● Quality ● Previous Quality Custom Filter Syntax To create a custom filter, you must know the data type of the column for which you want to apply the filter. The following examples should help you create custom filters without syntax errors. 1.
Operating Reference Log Viewer 3 settings as a log view definition. Using the search filter, you can filter the data for the columns that are present in the log view. You can also apply a search filter if you need to filter the data for a column that is not present in the log view. The combined search filter is always available in the Search Filter dialog box. For example, you can apply a result filter on the log data to retrieve all records with Source Description as "Analog Input 1".
3 Operating Reference Log Viewer Remove Filter Removes the filter set on the particular column. NOTE: In order to enable the Remove Filter button, you must select the check box preceding the Operator and Value fields corresponding to the result filter expression to be deleted. AND This is a logical operator that allows you to combine filter expressions and create complex filters.
Operating Reference Log Viewer 3 Time Filter Dialog Box Components Name A6V10415471_en_a_40 Description Result Filter Allows you to specify a result filter. Search Filter Allows you to specify a search filter. NOTE: The Search Filter tab does not display when the Time Filter dialog box is accessed from the Detailed Log tab in the Contextual Pane. Exact Allows you to filter data based on the exact date specified. Custom This option allows you to set the date and time as per your requirement.
3 Operating Reference Log Viewer Relative Relative has two options: Last and Current Period. The Last option allows you to filter data for the last 'x' (where x stands for a number) period that you specified. Valid periods are hours, months, years, weeks, days, or minutes. The Current Period option allows you to filter data for the current x period. Valid periods are current x hours, months, years, weeks, days, or minutes. For example, if the current date and time on your computer is 10/07/2014 10.
Operating Reference Log Viewer 3 Search Filter Dialog Box Components Description Available Columns1 Lists all the available columns from the Activities and Events Log. Operators1 Lists all the operators associated with a specific column selected in Available Columns. Values1 Lists all the values associated with a specific column selected in the Available Columns list. You can also select multiple values by pressing CTRL or SHIFT and selecting multiple values.
3 Operating Reference Log Viewer Detailed Log Tab You can view information related to system activities and events through the Detailed Log tab. The information displayed in the Detailed Log tab is related to the following: ● An object selected from System Browser: When you select an object from the System Browser, the Detailed Log tab displays the latest 100 activities for that object.
Operating Reference Log Viewer Record Type - Activity Record Type - Event Date/Time Date/Time Source Property RecordType LogType Source Property Action Details Event Message Action Event Category Value Event Time Previous Value Event Cause Quality Event ID Previous Quality Value Unit Unit Action Result User User Validation Profile Validation Profile Object Version Audit Trail Event Details Object Version Category Priority 3 Comment Reference Time Supervisor You can also sa
3 Operating Reference Address Book Name Description SaveAsDefault Saves the selected columns in the Detailed Log tab as a default template. Refresh Refreshes the data displayed in the Detailed Log tab. Stop Execution Stops the execution of the log view in the Detailed Log tab. Select Columns Displays the Select Columns dialog box that allows you to select the columns to display in the Detailed Log tab.
Operating Reference Address Book 3 Address Book Toolbar Controls Name Description Save Recipient Save any changes made to the details of the currently selected contact. Add Recipient Add a new contact to the address book. Remove Recipient Delete the currently selected contact. Remove All Recipients Clear the entire address book. Import Address Book Import a CSV contacts file exported from Microsoft Outlook.
3 Operating Reference Address Book ● To repeat a recent search, or to quickly filter by groups, click the Search-field drop-down list to display a list of your Recent Searches, along with a list of the configured Groups (under Saved Searches). – Click a search in the list to repeat it. – Click x alongside a search to remove it from the list. ● To clear a search, click alongside the search field to remove the filter and display the full contact list again.
Operating Reference Address Book 3 NOTE: Reports can be sent by email. Remote notifications can be sent by email, SMS, and/or pager. For each of these communication methods to work, the corresponding service (email, SMS or pager) needs to be configured on the Desigo CC server station. Preferred Device Expander ● ● Preferred Device: This is the first method of contacting the person to be tried. By default, it is set to the first email address that you configured in the Devices expander.
3 Operating Reference Remote Notifications ● Full Name. The contact’s first name, middle name and last name (with space as a separator) in the CSV file are used to populate the Full Name field in the address book. It is limited to 50 alphanumeric characters. ● Email. Email addresses are limited to 50 alphanumeric characters. If the email address in the CSV file exceeds this limit, the field in the address book is left empty.
Operating Reference Remote Notifications ● ● ● 3 For each individual contact, the address book stores a preferred device (email address, mobile phone number, or pager number) that can be used to contact that person, and optionally also a fallback device. Desigo CC will attempt to send the notification to all the members of each recipient group, using the preferred and (if available) fallback devices configured in the address book.
3 Operating Reference Remote Notifications Cases where the Message Status list opens automatically: ● After sending an operator-issued remote notification the Message Status list displays in the Secondary pane. ● When executing the RENO step in an assisted treatment procedure the Message Status list displays in the Assisted Treatment window.
Operating Reference Remote Notifications 3 Figure 24: Message Status List in the Primary Pane Figure 25: Message Status List in the Secondary Pane Information Provided in the Message Status List In the Message Status list, each notification displays on a separate (expandable) row. The topmost row shows a compact notification summary with the most important information about the notification. See the tables below for a detailed key to the information provided in the Message Status panel.
3 Operating Reference Remote Notifications Compact Notification Summary (information in unexpanded/topmost row) For new (operator-issued) notifications: [type of sending (always manual)] – [date and time] – [overall RENO outcome ] For alarm-triggered notifications: [Name] – [Alarm ID] – [type of sending (automatic/manual)] - [overall RENO outcome] Type of sending For alarm-triggered notifications, can be automatic or manual depending on configuration. For operator-issued notifications is always manual.
Operating Reference Remote Notifications 3 Recipients Summary The first level of the recipients’ summary shows a list of the recipient groups configured for the remote notification. You can expand each recipient group to see further details about that group and its members.
3 Operating Reference Remote Notifications Status Applies to group status, escalation status, and notification status of an individual contact. Empty The remote notification has not started yet. Running The remote notification is in progress. Pending The message has been sent to the designated recipients and the system is awaiting a reply (the timeout for a response has not yet elapsed). Acknowledged The designated recipients replied within the timeout.
Operating Reference Remote Notifications 3 Message Status Summary Situation Status Remote notification outcome Groups Recipients The remote notification is initialized, but has not yet started. Initialized — — The remote notification is automatic and time-delayed, and the operator stops it before it starts. Aborted Cancelled Cancelled Pending Acknowledged The remote notification has Running started (regardless of whether it is automatic or manual).
3 Operating Reference Remote Notifications The operator has stopped the manual remote notification. Aborted Cancelled Acknowledged Timed out The status of the recipients that replied does not change. Cancelled The status of the recipients that did not reply within the timeout does not change. The status of the recipients that replied after the remote notification is aborted changes to Acknowledged. No replies are required for a group and the related recipients.
Operating Reference Remote Notifications 3 Figure 26: New Remote Notification – Edit Mode New Remote Notification Toolbar Controls Send this message Send a new operator-issued remote notification.
3 Operating Reference Documents 3.10 Documents This section provides background information on viewing documents, files, web links or other resources in Desigo CC. For related procedures see the step-by-step [➙ 165] section. 3.11 Other Applications This section provides background information for operating the other applications in Desigo CC. For related procedures, see the step-by-step [➙ 166] section. 3.11.
Operating Reference Other Applications 3 When you select an external web application fixed link: ● The corresponding external web application displays the current data (including event information of the associated point). Regardless of the number of parameters included in the XML configuration file, the Extended Operation tab only displays a maximum of ten parameters that you can modify. An error informs you if the data you modified is invalid.
3 Operating Reference Other Applications Web Links Library Block Web Links is the library block that serves as a support library for setting the XML configuration file for an external web application. You can create multiple library blocks of this type per library. NOTE: Only Headquarter experts and Customer Support are authorized to modify the web links at L1-Headquarter level. The customization of L1-Headquarter to a lower level is not supported by web links.
Operating Reference Other Applications 3 Application Viewer Workspace Application Viewer Toolbar The Application Viewer toolbar allows you to work with fixed web application links. Icon 3.11.1.2 Name Description Show all Select external web application to display. The menu displays a maximum of 10 items in the list. Set Execution Credentials Set the execution policy for a script. Clear Execution Credentials Clear the execution credentials.
3 Operating Reference Other Applications Rule Editor Workspace The Rule Editor workspace consists of the Rule Editor pane and the Rule Editor toolbar. General Settings When you configure a display rule for an external web application, the General Settings expander lets you modify the description of the purpose of this rule. In Operating mode, this information will help the user to choose which external web application to work with in case of rules multiple matching.
Operating Reference Other Applications 3 – Replace Existing Filter: The linked objects will replace the existing ones in the Path field. – Add New Filter: Creates a new row with the linked objects added to the Path field of the new row, and all the other fields set to All. – Cancel Operation: Operation is canceled. ● In the Path field you can also: – Click the drop-down list to view all the linked objects. – Click the x next to an object to remove it.
3 Operating Reference Other Applications Advanced Settings Item Description Application Select an application associated with the URL. Label Report Template Advanced Settings This section allows you to enter a fully qualified URL that is not dependent on an XML file. A fully qualified URL contains the http:// or https:/ protocol. This setting overrides an XML file. Advanced Settings Item Description Application URL Enter the URL address.
Operating Reference Other Applications 3.11.2 3 Validation The Validation feature is designed for projects in critical environments and helps protect against inadvertent changes that might damage system functions. For procedures or workflows, see the step-by-step [➙ 169] section.
3 Operating Reference Other Applications Examples The object version will change when modifying or commanding a configuration property like the High Alarm Limit or Discipline. The object version will not change when commanding the Present Value property. Validation Indicator When you select a validated object in the system, a visual indicator displays next to the object name in the Operation and Extended Operation tabs.
Operating Reference Other Applications 3 Four Eyes Enabled – Examples of Validation Required Dialog Boxes Monitored Validation Profile Enabled Validation Profile A6V10415471_en_a_40 349 | 352
3 Operating Reference Other Applications Supervised Validation Profile 350 | 352 A6V10415471_en_a_40
Operating Reference Other Applications A6V10415471_en_a_40 3 351 | 352
Issued by Siemens Switzerland Ltd Smart Infrastructure Global Headquarters Theilerstrasse 1a CH-6300 Zug +41 58 724 2424 www.siemens.com/buildingtechnologies A6V10415471_en_a_40 © Siemens Switzerland Ltd, 2019 Technical specifications and availability subject to change without notice.