
User Guide


Reports
9
Examples
315
Siemens User Guide Version 2.1
A6V10415471_en_a_21
Building Technologies 2015-07-15
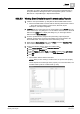
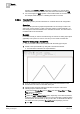
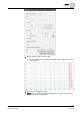
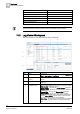
4. Run the report [➙ 280] to view the data.
The report displays the graphical representation of the data for the current
10 hour period.
5. Save the report definition [➙ 278].
NOTE: You can enhance the report configuration at any time, in the future, by
changing the name and time filters.