
User Guide


9
Reports
Examples
314
Siemens User Guide Version 2.1 A6V10415471_en_a_21
Building Technologies 2015-07-15
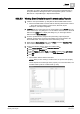
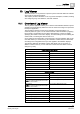
operator, press SHIFT or CTRL, depending on whether you want to select
values listed next to each other or away from each other and then click
Add.
You cannot apply the NOT operator in the Condition Filter for an Events table.
For example, NOT 'Discipline' = "Building Automation" is invalid.
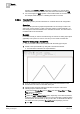
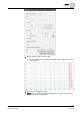
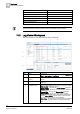
9.22.5 Trends Plot
The following section provides information on a Trends Plot and its configuration.
Overview
The Trends Plot provides a graphical representation of the change of value of an
object over a period of time. In order to view the change of value graphically, you
must assign a Trend View Definition as a name filter to the Plot. You cannot add a
Condition Filter to the Trends Plot.
Example
Let us assume that you want to track the change of value of an Analog Input object
graphically over a period of 10 hours. For this you must create a Trends Plot.
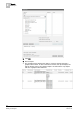
Steps for Configuring a Trends Plot
You have created a Trend View Definition with the Analog Input object.
1. Create a new report definition [➙ 262] with a Trends Plot inserted.
A Trends Plot is inserted in the report definition.
2. From the System Browser, drag-and-drop the Trend View Definition to the
Trends Plot. This acts as a name filter to the plot.
3. Specify the time period by adding a Time Filter to the plot. Perform the
following steps to add the Time filter:
a. Right-click the Trends Plot, point to Filters and select Time Filter. The Time
Filter dialog box displays.
b. Select the Relative option.
c. Select the Last or Current Period option, depending on the data requirement
for the last 10 hours or current 10 hours. For more information regarding setting
the time period, see Time Filter [➙ 243]. In this case, we will obtain the data for
the current 10 hours by selecting Current Period and specifying 10 hours.
d. Click OK.