
User Guide

9
Reports
Creating and Viewing a Report as a PDF or Excel
286
Siemens User Guide Version 2.1 A6V10415471_en_a_21
Building Technologies 2015-07-15
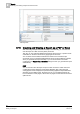
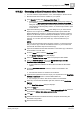
In order to perform analysis on a specific set of columns in a table, you can add a
PivotTable or chart to the generated Excel document and set this document as a
template to the report definition having this table. When you run the report and
generate the Excel document, information related to the columns you added to the
PivotTable or chart displays in a separate worksheet.
The PivotTable or chart in the template must have columns of only those tables
that are present in the report definition. For example, if you have a report definition
with an All Logs table, the PivotTable or chart in the Excel document that is set as
a template to this definition must have columns specific to the All Logs table only.
In case of an Event Details table, you must remove all the child columns for the
PivotTable to be displayed.