
User Guide


9
Reports
Configuring a Report Definition
266
Siemens User Guide Version 2.1 A6V10415471_en_a_21
Building Technologies 2015-07-15
2. Either right-click the table and select Delete, or press the DEL key.
A confirmation message displays.
3. Click Yes to confirm.
The table is deleted from the Report Definition.
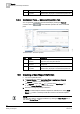
9.7.2 Inserting a Plot
You have selected an existing Report Definition in System Browser > Reports
or you have created a Report Definition and now want to configure it.
1. From the Reports ribbon, click the Home tab.
2. Do one of the following:
– From the Insert group box on the Home tab, click the Plot group box, and
select any plot (Trends, Graphics), and drag-and-drop it onto the selected
Report Definition.
NOTE: The cursor changes and indicates the selected plot name.
– Right-click the Report Definition and select the required type of plot from
the
Insert Plot option.
– Drag-and-drop the desired Trend View Definition/Graphics View Port from
the System Browser tree on the Report Definition. The Name Filter of the
inserted plot is set to the dropped Trend View Definition or Graphics View
Port.
The plot placeholder is added to the Report Definition. By default, the plot is
left-aligned.
NOTE: In Run mode, this plot image is replaced by the actual data retrieved
from the Report service.
NOTE 1:
You cannot insert a plot in the header/footer section.
NOTE 2:
You cannot apply font types, size, and color on a plot.
NOTE 3:
If you select a plot in the Report Definition and right-click, you can move, set
position, apply filters, and delete the plot.
9.7.2.1 Deleting a Plot
At least one plot is inserted in a Report Definition that you have selected.
1. From the Report Definition, select the plot you want to delete.
The border color changes to indicate the plot selection.
2. Either right-click the plot and select Delete, or press the DEL key.
A message displays.
3. Click Yes to confirm.
The plot is deleted from the Report Definition.
9.7.3 Inserting Text (Label)
1. Do one of the following: