
User Guide

Reports
9
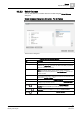
Reports Workspace
233
Siemens User Guide Version 2.1
A6V10415471_en_a_21
Building Technologies 2015-07-15
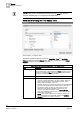
Column names with and without square brackets [].
You may observe that some column names in the Available Columns list are
enclosed within square brackets[], whereas some are not. This occurs for the
following reasons:
In the Object Model, each property name has a property descriptor attribute. If
the same property is used in more than one Object Models, and the property
descriptor is same in all instances, then for such property, the property
descriptor displays as the column name in the Objects table. For example, the
Out_Of_Service property is common to BACnet Analog Output and Desigo
TRA Analog Output object models. The property descriptor associated with the
Out_Of_Service property for both these models is Out-of-Service. Therefore the
name displayed in the Objects table is Out-of-Service.
If the same property is used in more than one Object Models, however the
property descriptor is not same in all instances, then for such property, property
name displays as column name in the Objects table and is enclosed within
square brackets. For example, the
Event_State property is common to the
BACnet Analog Output and Desigo TRA Analog Output object models.
However, the property descriptor associated with this property in the BACnet
Analog Output model is EventState and in the Desigo TRA Analog Output is
Eventstate. Therefore the name displayed in the Objects table is [Event_State].
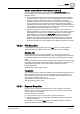
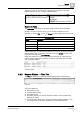
9.2.2.3 Plot Group Box
A
plot
displays data in a graphical view. The Plot group box contains different
graphic elements from different data sources such as Trends and Graphics.
Graphics Plot
You can drag-and-drop any graphics definition or manual view port from the
System Browser tree onto a Report Definition to insert a graphics plot. This inserts
a placeholder graphics plot and sets the Name Filter to the dragged and dropped
object.
When you execute a report containing a graphics plot, it displays the graphic image
associated with the dragged and dropped object. If the object is not present in any
of the graphics definitions, then an error message displays in the report
management section.
Applicable filters: Name Filter [➙ 238]
Trends Plot
You can drag-and-drop a trend view definition from the System Browser tree onto a
Report Definition to insert a trends plot. The system behaves the same way as
when inserting a graphics plot. For more information on the Trends Plot and it's
configuration, see Trends Plot [➙ 314].
Applicable filters: Name [➙ 238] and Time [➙ 243]
See also Inserting a Plot [➙ 266]
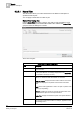
9.2.2.4 Keyword Group Box
Keywords are pre-defined templates that can be added anywhere in a Report
Definition. They are replaced with actual data in
Run mode
and when the report
document (PDF, XLS) is created.
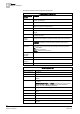
There are two types of keywords:
Content-specific, which can be inserted only above tables/plots
Generic, which can be inserted anywhere including the header and footer of
the Report Definition
For example, you can add the Date keyword in the Report Definition header to
display the date on which the report is executed.