
User Guide


Trends
8
Analyzing Trend Data
213
Siemens User Guide Version 2.1
A6V10415471_en_a_21
Building Technologies 2015-07-15
NOTE 1:
When you use
Export
in the table view, the exported data range depends on the
time setting in the graphical view.
NOTE 2:
Interpolated values are not exported to an export file.
NOTE 3:
The priority displays in the table if a subsystem supports information on BACnet
write priority (1-16).
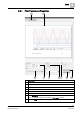
8.7.11 Temporarily Highlighting Data Series
During analysis, it is helpful to temporarily bring a certain series in the Trend View
to improve the readability of the trend curve.
You are in Trend View and multiple trend curves are displayed.
1. Drag the pointer to the trend curve you want to bring forth.
All non-selected trend curves are reduced in their display intensity.
The measured value as well as time and date are displayed in tooltip at the
pointer position.
The quality attribute is brought forth when only one trend curve is visible.
2. Drag the pointer to once again view all trend curves.
8.7.12 Temporarily Hiding Data Series
You can temporarily or permanently hide multiple series to increase the readability
of the Trend View.
You are in Trend View and multiple trend curves are displayed.
1. Click Properties .
The menu bar displays above the Trend View.
2. Select the series you want to hide in Legend.
3. Click Series Properties.
4. Clear the Visible check box.
The menu bar is hidden.
The series is hidden in the Trend View.
The Trend data is still recorded for this series, but is no longer displayed.
5. Click Save .
Repeat Steps 2 through 4 for each additional series you want to hide.
NOTE:
As an alternative, you can click eihter or in the legend. This allows you to
show or hide each individual trend curve.