
User Guide


8
Trends
Analyzing Trend Data
212
Siemens User Guide Version 2.1 A6V10415471_en_a_21
Building Technologies 2015-07-15
– Click one of the predefined offset buttons (for example, 1 hour).
– Select your own range by selecting the dark button
(for
example, 3 hours) and select the time offset
.
Comparison view displays with the corresponding time offset and
measured values.
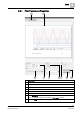
8.7.9 Using Mouse Zoom
The zoom function allows you to select a time range in the currently selected Trend
View (applies as well for the comparison view) by zooming in on the X-axis and Y-
axis.
You are in an active Trend View and in Stop
mode ( ) displays.
1. Click Zoom .
2. Using your cursor, move the point to the left zoom starting range.
The point changes shape and the tooltip displays the current position.
3. Hold down the left mouse button, and drag the pointer to the right zoom end
range.
4. Release the mouse button at the desired position.
The selected zoom range displays in the Trend View.
5. Click Zoom .
The original time range, prior to the zoom in, displays, even if you zoom
multiple times.
8.7.10 Selecting Table View
Switching between graphic and table allows for efficiently analyzing data.
A Trend View is open.
1. Click Stop .
The automatic data update is stopped.
2. Click Table View (see Table View [➙ 191]).
The table opens in default view. Click the time stamp header to sort the
rows by ascending or descending order.
3. Click to show or hide interpolated values.
Interpolated values are displayed in light-grey.
4. Click Table View again .
The graphical Trend View re-displays.
5. Click Run to start the automatic data update.