
User Guide


Trends
8
Analyzing Trend Data
207
Siemens User Guide Version 2.1
A6V10415471_en_a_21
Building Technologies 2015-07-15
8.7 Analyzing Trend Data
The collected measured values serve as an indicator for an analysis of your plant.
It is important to be able to easily find the appropriate data as needed. Desigo CC
provides you a number of tools including time range scrollbars, context menus with
predefined times, absolute/related time entries or zoom functions.
1. In System Browser, select Application View.
2. Select Applications > Trends > Trend View Definitions > [Name of folder
structure] > [Name of Trend View].
The Trend View opens.
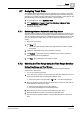
8.7.1 Switching between Automatic and Stop Mode
Automatic mode normally is used to analyze trend data (continuous scrolling of the
graphic curves). The latest data are always loaded automatically from the system.
You can change to manual mode for a detailed analysis (scrolling mode off). In this
case, the management station data no longer is updated automatically from the
system.
The Trend View is open.
1. Click Stop .
This stops automatic data updates and suppresses the symbol to update
Trend View.
2. Define the desired date range using the slider or time bar.
3. Click Refresh when the symbol is available and you want to upload the
latest data from the history database.
4. Click Run to update data on a continuous basis.
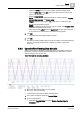
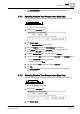
8.7.2 Selecting the Time Range using the Time Range Scrollbar
Setting Time Range and Time Window
You intend to define the visible time range as well as the corresponding time
window for the Trend View.
You are in an active Trend View.
1. In the Trend View, point the mouse to the left or right slider (dark grey area) for
the time range slider (see Time Range Scrollbar [➙ 180]).
The mouse pointer changes shape
and the tooltip displays.
2. Press the left button and move the time range slider to the left or right until you
have reached the desired time range.
The time range change continuously displays.
The Trend View displays the selected time range.
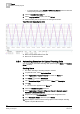
3. Move the mouse cursor to the time range slider (light grey area).
4. Press the left button and slide it to the desired time/data range.
The time range is displayed with the corresponding data period in the Trend
View.