
User Guide


8
Trends
Defining Trend Views
192
Siemens User Guide Version 2.1 A6V10415471_en_a_21
Building Technologies 2015-07-15
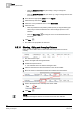
8.5 Defining Trend Views
You need a Trend View definition to graphically record data. The Trend View
definition includes all properties required for graphical display of the Trend View
and the series. Measured value data belonging to the given series such as
time/date, value or period are saved in the Trendlog object and can only be
displayed in the Trend View definition.
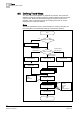
Steps
The following illustration shows a general workflow to creating a Trendlog. For
more information, see the detailed workflows in the following chapters.
End
Start
- Properties
- Axis
- Legend
- Background
Create Trend View
Change user default
Change user default
Yes
No
Select data point
Select Trend-Log
Select data point
System Browser
Trend-Log object
System Browser
Data point tree
Configure diagram
Configure data serie
Save Trend View
Assign data serie
- Line type
- Line size
- Line color
- Marker
- Label
- Quality attributes
Select New Trend in
Related Items
System Browser
Data point tree