
User Guide


Trends
8
Working with Trends
191
Siemens User Guide Version 2.1
A6V10415471_en_a_21
Building Technologies 2015-07-15
Only the highest priority displays in the Trend View if several states are active. The
priority sequence in the previous quality attributes table is read in descending order
(highest to lowest priority). With the reduced display
, not all quality attributes
display. In order to display all quality attributes, limit the time period.
NOTE:
Quality attributes can only be evaluated if this function supports the
corresponding subsystem. An alarm setup on the management station does not
possess quality attributes: therefore an alarm cannot display an alarm bell in the
Trend View.
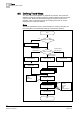
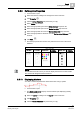
8.4.8 Table View
The table view offers a view that differs from the standard view where curves are
displayed as series.
The table view displays each series as a column in the data grid. The first column
(right) shows the time stamp. The column displays by merging all time stamps for
all values in each series. It is displayed at an accuracy of 1 second.
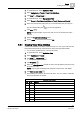
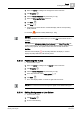
Description
1 Timestamp for measurement.
2 Sorts values by ascending or descending timestamp.
3 Displays data point name and corresponding color in the graphical view.
4 Displays the quality attribute with measured value, except
Normal
.
5 Displays interpolated values when this function is active.
NOTE:
The priority is displayed in the table if a subsystem supports information on
BACnet write priority (1‒16).
6 Displays the values in a reduces manner and with a red background if too long a
time frame is selected in the Trend View.
7 Shows/hides the interpolated values.
There are two display types in table view:
Normal view: The corresponding cell has a value or is empty.
Interpolated view: The corresponding cell is
empty
and shows a linear
interpolated value based on previous current and subsequent current selection.
NOTE:
The table view only shows values as per the graphical time range. These values
are exported during data export.