
User Guide

Trends
8
Working with Trends
187
Siemens User Guide Version 2.1
A6V10415471_en_a_21
Building Technologies 2015-07-15
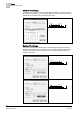
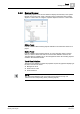
Reduced Display
Displays a maximum of two values per interval. The interval is calculated based on
the set sample rate for the Trend View (Trend Chart Properties).
1 interval = Max. displayed samples per series/2.
– Example 1: 100/2 = 50 intervals
– Example 2: 400/2 = 200 intervals
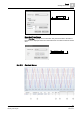
A reduced display can also occur with just a few values. For example, when the
values are recorded within a short interval. With the reduced display, minimum and
maximum values always display.
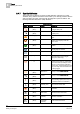
Quality attributes:
With the reduced display, not all quality attributes can be displayed. In order to
display all quality attributes, limit the time period.