
User Guide

8
Trends
Working with Trends
186
Siemens User Guide Version 2.1 A6V10415471_en_a_21
Building Technologies 2015-07-15
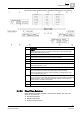
8.4.4 Data Point Key
The legend for the series contains information on the given data point in the Trend
View.
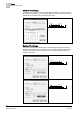
NOTE:
Use the context menu to hide columns by pointing to the column (Hide Column)
or show/hide individual columns (Visible Columns). Column order and width is
adjustable with the exception of the first column (colors, cannot be adjusted,
moved or hidden).
That most recent value displays in the time bar. In this case, the value or the
information displays at the intersection.
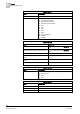
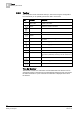
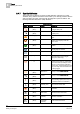
Data Point Key
Column
Description
Series source. Indicates if the displayed data is recorded by the
management station data (online
) or a field device (offline ).
Trended
Object
Displays the object names for the Trendlog object.
Trended
Property
Displays the trended property name for the object.
Alias Displays the alias name for the object.
Unit Physical unit for the data point.
Value Displays the last displayed current value (unless the time bar is in use. In
this case, the value is displayed at the intersection).
Time Displays the time for the most recent value (unless the time bar is used; in
this case, the value is displayed at the intersection).
Date Displays the date for the most recent value (unless the time bar is used; in
this case, the value is displayed at the intersection).
Reduced
When this symbol
displays, not all values for this series are displayed in
the Trend View (dependent on the displayed time period) (see
Reduced
Display
).
Y-axis Indicates the Y-axis where the point is scaled.
Remove Removes the selected trend value from the Trend View.
Show/hide Temporarily shows/hides the trend curve in the Trend View.