
User Guide


8
Trends
Working with Trends
180
Siemens User Guide Version 2.1 A6V10415471_en_a_21
Building Technologies 2015-07-15
Item
Description
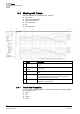
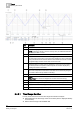
1 Displays title of current Trend View.
2, 11 Displays and highlights the selected trend curve in Trend View.
NOTE:
To display a change of value on a binary value, an additional dotted zero
line displays at State 1 or One.
3, 12 Displays unselected trend curves as collapsed curves.
4 Displays the time bar. The time bar can be dragged anywhere on the time axis.
The data legend at the bottom of the Trend View displays the value or state valid
at the point where the bar intersects with the series. When the time bar is hidden,
the legend displays the last correct value for the Trend View.
5 Displays the present measured value for the series at the cursor. The current
measured value in a graphic curve is displayed by moving the mouse pointer to
the desired position. The precise measured points can be better displayed by
enabling the marker for the series.
6 Displays the Y-
axis with the appropriate scaling. Each chart can display a left and
right Y-axis independent of each other. Data series can be selectively assigned
and scaled to either axis (by default or manually).
7 Legend header.
8
Online:
Current value from the automation station.
Offline Trend:
The values are displayed as a function of the time bar [3].
9 Displays time or date range display across the entire selected display range.
10 Displays time range scrollbar (see Time Range Scrollbar [➙ 180]).
13 Displays time and/or date display for the grid.
14 Displays time range display between grid sections.
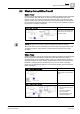
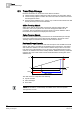
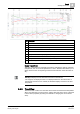
8.4.3.1 Time Range Scrollbar
In every Trend View, there are two time ranges of interest for analysis:
Data displayed in the time range of the current chart (which is displayed directly
on the screen).
Data in the time range of all available data.