
User Guide


Trends
8
Working with Trends
177
Siemens User Guide Version 2.1
A6V10415471_en_a_21
Building Technologies 2015-07-15
Menu
Description
Line Properties Defines the appropriate property type, form and color, as well
as the property for the series (see the Table Line Properties
below).
Visible Displays the trend curve if this check box is selected.
Show Markers Defines the corresponding property type, and size, as well as
the corresponding property for the series. The markers are only
displayed in the trend curve if this check box is selected.
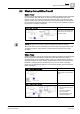
The X-axis is always the time axis. The diagram display is
calculated to correspond to the selected time line.
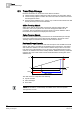
Show Values Displays numerically each measured value for the read value if
this check box is selected. Values may overlap (unreadable) in
the Trend View for intensive measured recorded values or a
time range that is too large. In this case, select a smaller time
range or switch to display values.
Show Quality Icons The Trend View can display a number of state attributes,
referred to as quality attributes, along with the trend data.
These enable you to identify problems with the data point being
recorded, and assist with the diagnosis of plant conditions.
See also Section Quality Attributes [➙ 190].
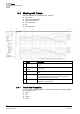
Line Properties
Line type Line style Stroke color Stroke
thickness
Marker style Marker
thickness
1-6
1-10
8.4.1.5 Colors
You can assign a color to the Trend View (background color) or to each individual
series (line). You can choose between:
Predefined set of colors.
Custom colors.