
Operating Instructions
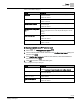


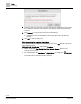

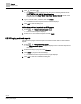

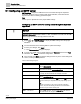
Table Of Contents

Trends
Trends tools
62 | 80
Siemens
A6V11211557_enUS_b
Building Technologies
2019-01-15
Setting
Description
Time of export
The default setting is Weekly, Monday, –.
If Field 1 is …
Field 2 options
Field 3 options
Daily
–
–
Weekly
Monday
Tuesday
Wednesday
Thursday
Friday
Saturday
Sunday
–
Monthly
Week 1 (Days 1-7)
Week 2 (Days 8-14)
Week 3 (Days 15-21)
Week 4 (Days 22-28)
Week 5 (Days 29-31)
Monday
Tuesday
Wednesday
Thursday
Friday
Saturday
Sunday
Time
The default setting is 05:00 or 5:00 AM, depending on the selected time
format.
● Field 1: Hours
● Field 2: Minutes
7.5.2 Adding a chart view
Chart views can be defined for online and offline trended objects. The Operation
application supports a maximum of five chart views.
Prerequisites
● The trended data points are integrated to the Desigo Control Point device.
● For online trended objects, the trend definition must be created.
Adding a trend definition [➙ 60]
1. Select > > Create chart.
2. Navigate through the building structure and use the toggle buttons to select the
object(s) to display in a chart.
Only objects that currently have a trend definition are displayed.
Click OK to continue defining the chart view.
3. Do the following to save the chart view at the currently-selected location in the
building structure:
– Select > .
– Type a name for the chart view in the field at the top of the dialog box.
– Click Create to save the chart view.
For information on saving the chart view to a folder, see the Options for saving chart
views [➙ 54] section.