
Operating Instructions
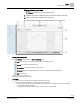
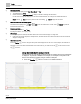
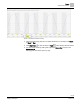
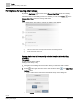
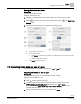
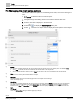
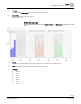

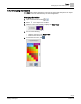
Table Of Contents

Trends
Managing the chart series options
56 | 80
Siemens
A6V11211557_enUS_b
Building Technologies
2019-01-15
7.4 Managing the chart series options
This section outlines the options for customizing chart views, such as the chart type or
color.
Trends is selected in the core function pane.
1. Navigate through the building structure to locate the desired chart view.
2. Select a chart view to display it in the work area.
3. Select > to display the Series Options dialog box.
4. Select to the left of an object name to display the series options for that object.
①
Interval
For chart views containing analog data, this property defines the time interval for the x-axis division points. The default is Auto.
● When Auto is selected, the chart view determines the interval based on the sample data.
● When a different interval is selected, such as 1 hour, the tic marks on the x-axis are labeled for the selected interval.
②
Color
Defines the color used to plot the trended data for an object.
③
Chart type
Defines the format of the chart. The following figure shows an example of each chart type.
Chart view example [➙ 57]
④
Convolution
For chart views containing analog data, this property works in conjunction with the Interval to perform logic on the sampled data.
The result of this logic is displayed on the chart. Convolution is only available when Interval is not set to Auto. For example, if
Interval is set to 1 hour and Convolution is set to Average, the chart view displays the average of the samples taken each hour.
⑤
Cancel
Closes the Series options dialog box without applying any changes.