
Operating Instructions
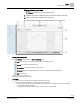
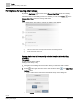
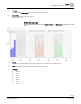

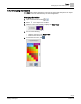
Table Of Contents

Trends
Trends user interface
53 | 80
Siemens
A6V11211557_enUS_b
Building Technologies
2019-01-15
Figure 10: Timeframe restricted to one day.
● Change the date range selector to a smaller timeframe. For example, from Month
to Week or Day.
● Click Chart view to view the data in a Table , which displays all trend values.
● For chart views containing analog data, adjust the Convolution property in the
Series settings.
Managing the chart series options [➙ 56]