
Operating Instructions
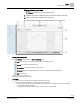
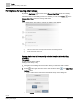
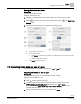
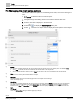
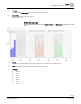

Table Of Contents

Trends
Trends user interface
52 | 80
Siemens
A6V11211557_enUS_b
Building Technologies
2019-01-15
③
Date range selector
Trended data can be displayed by the Day, Week, Month, or Year.
● The default display is Today.
● Click the center of the Date range selector to display a calendar for selecting other timeframes.
Use the arrows to change the display by one unit of the selected timeframe. For example, if the selected timeframe is
Month, selecting Back displays the previous month and selecting Forward displays the next month.
④
Chart view / Table view and Refresh buttons
Trend data can be displayed in a Chart or Table format. The default view is a chart. Select Refresh to update the
trend data used for the chart.
⑤
Manual export button
Click to export trend data as .csv or .json.
Exporting trend data as .csv or .json [➙ 55]
⑥
Charted data
● If multiple objects are selected, trend data with the same unit of measure displays in a single chart.
● If the Chart View contains objects from multiple devices, trend data from the same device and with the same unit of measure
displays in a single chart.
⑦
Chart timeline selector
Move the Timeline buttons to change the time period of data displayed across the x-axis. In this example, the full timeline is
displayed. To focus on the data collected between 3:00 am and 9:00 am, you would move the left to 3:00 am and move the
right to 9:00 am.
Using the trend chart to analyze trends
The trend chart can only display a certain number of samples when the full timeframe
is displayed. To perform a detailed trend analysis, for example to find peaks in the
data, do the following to display a larger number of samples:
● Move the Timeline buttons to zoom in to a smaller timeframe.
Figure 9: Full timeframe displayed.