
Operating Instructions
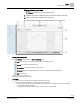
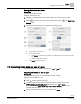
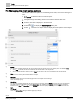
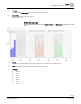

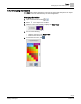
Table Of Contents

Trends
Trends user interface
51 | 80
Siemens
A6V11211557_enUS_b
Building Technologies
2019-01-15
Viewing a saved chart view
Trends is selected in the core function pane.
1. Navigate through the building structure to locate the desired chart view.
2. Select a chart view to display it in the work area.
The following figure outlines the information displayed in the work area.
①
Settings for the displayed chart
Select Settings to display or hide the Chart View Settings menu.
Save saves the chart to the currently-selected location in the building structure.
Save as saves the chart with a different name.
Series options customizes the chart type, chart colors, etc.
Delete chart deletes the currently displayed chart. This does not affect the related trend definition.
Exit closes the chart.
Options for saving chart views [➙ 54]
Managing the chart series options [➙ 56]
②
Chart legend
● Outlines the colors used to plot the trended data for each object in the chart.
● To temporarily hide the trended data for a particular object, do the following:
– Select the object in the legend to remove its graph from the displayed chart. The object name and its corresponding
color will display dimmed in the legend.
– To redisplay the trended data for hidden objects, select the object in the legend again.