
Operating Instructions
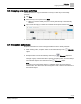
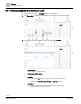
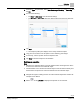
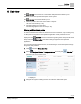
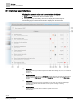
Table Of Contents

Trends
Trends user interface
50 | 80
Siemens
A6V11211557_enUS_b
Building Technologies
2019-01-15
7 Trends
The Operation application supports both online and offline trends.
● For
online
trends, the Desigo Control Point device collects the trend data.
– Trend data for each object can be collected by both timed interval and change-
of-value (COV).
– The total number of trend definitions allowed is limited by the device type.
● For
offline
trends, the Desigo Control Point device retrieves data stored in the
remote device’s trend objects.
The Trends core function allows you to:
● View trended data in a chart or table format.
Trends user interface [➙ 50]
● Save chart views.
Options for saving chart views [➙ 54]
● Export trend data as .csv or .json.
Exporting trend data as .csv or .json [➙ 55]
● Customize the colors, chart type and interval of time for a chart, and move a
sample set from one chart to another.
Managing the chart series options [➙ 56]
Use the Trends tools (for users with the appropriate role assignment):
● For online trended objects, add, edit, and remove data points from a trend
definition.
Adding a trend definition [➙ 60]
Editing a trend definition [➙ 63]
Removing data points from a trend definition and archiving data [➙ 63]
● Add a chart view.
Adding a chart view [➙ 62]
● Export trended data to an FTP Server or email recipients.
Configuring a scheduled export of trend data to an FTP server or email [➙ 60]
7.1 Trends user interface
This section outlines the Trends view user interface for displaying saved chart views. A
chart view displays the samples collected for a trended object. Chart views are saved
in the Choose Chart View list of the currently-selected location in the building structure.