Desigo Control Point Operation Manual for Americas Region A6V11211557_enUS_b 2019-01-15 Building Technologies
Edition notice Edition notice Technical specifications and availability subject to change without notice. This document may not be reproduced, disseminated to third parties or processed and its contents may not be used or disclosed without express permission. Non-compliance shall result in compensation for damages. All rights, including those resulting from a successful patent application and registration of a utility model or design patent, are reserved.
Copyright Notice Cyber security disclaimer Copyright Notice Notice Document information is subject to change without notice by Siemens Industry, Inc. Companies, names, and various data used in examples are fictitious unless otherwise noted. No part of this document may be reproduced or transmitted in any form or by any means, electronic or mechanical, for any purpose, without the express written permission of Siemens Industry, Inc.
Copyright Notice Trademarks Oracle and Java are trademarks or registered trademarks of Oracle America, Inc. Further to the notes in this section, and to facilitate the reading of the text, these trademarks will not be indicated elsewhere in the text by use of symbols, such as ® or ™. .
Table of Contents Copyright Notice ......................................................................................................... 3 Cyber security disclaimer ................................................................................................ 3 Trademarks ..................................................................................................................... 3 1 General information ..........................................................................................
7.1 Trends user interface .......................................................................................... 50 7.2 Options for saving chart views ............................................................................ 54 7.3 Exporting trend data as .csv or .json ................................................................... 55 7.4 Managing the chart series options ...................................................................... 56 7.5 7.4.1 Moving a chart .................
General information Target readers 1 General information This section covers conventions used in the manual, how to access help, related publications, and other information to help you use this manual. Document use / request to the reader Before using our products, it is important that you read the documents supplied with or ordered at the same time as the products (equipment, applications, tools etc.) carefully and in full.
General information Additional resources 1.2 Additional resources ● ● ● 8 | 80 Siemens Building Technologies E-learning modules on engineering and commissioning workflows. – Desigo Control Point Basics (B_E01DECP) https://intranet.sbt.siemens.com/SBTAcademy/ELearning/E01DECP/EN/E01D ECP_en_DesigoControlPoint - Storyline output/Start_ELearning.html – Desigo Control Point Engineering & Commissioning (B_E03DECP) https://intranet.sbt.siemens.
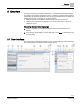
Overview User interface 2 Overview The Desigo Control Point Operation application is a full-featured Web-based solution for managing your building automation system. In addition to operating HVAC, lighting and shading, the Operation application provides energy dashboards for managing and analyzing the energy consumption of monitored systems. ● Different features are available in different Desigo Control Point devices.
Overview User interface ① Main menu Click to navigate to the ABT Setup & Service Assistant (SSA). ② Core function pane Plant view displays customized and standard graphics with real-time data point values and status updates. Alarms displays active alarms and alarm history and allows you to send alarm notification emails. The Alarms button has a red shadow when there are active or unacknowledged alarms. Scheduler configures the schedule program and creates exceptions for existing schedules.
Overview User interface ⑧ Tools and settings Click to access the tools and settings menus. The options displayed depend on the role of the currently logged in user. Full screen is mainly for use with a graphic display. When selected, the browser bar displays at the top of the screen, but the Status bar (⑥) and the Core function pane (②) do not display. Tools provides tasks that are specific to each core function.
Overview User interface Indicator Description BACnet object type Process value APrcVal, BPrcVal, MPrcVal Configuration value ACnfVal, BCnfVal, MCnfVal, UCnfVal Trigger value MTrgVal Centralized command grouping objects Command object CmdObj Group master GrpMaster Group member GrpMbr System objects Controller Loop Alarm and trend objects Event enrollment CmnEvtEnr, EvtEnr, DevAlert Trend log TrndLogS Other special Objects AppCnf, CmnEvt, DevObj, FileObj, FldBusMgmt, NotifClass, NwkPort
Overview User interface 2.1.2 State indicators The state indicator icons represent the current condition of functions and/or objects associated with a room.
Overview User management 2.2 User management Click in the status bar to display the following options in the user management menu: As shown in the following figure, the options displayed depend on the role of the currently logged in user. ● ● User profile and Log out are available to all users. Manage users is only available to users with administrator privileges. User profile Allows the currently logged in user to modify settings for their own account.
Overview User management 2.2.1 Managing user profiles User roles that have been granted access to Manage users in the User management menu are allowed to add, edit and delete user profiles and change another user’s password. Managing password security To help ensure a secure operating environment, use the following password recommendations when adding user profiles: ● Create unique usernames/passwords for each user. ● Do not create a common username/password to be shared by all employees.
Overview User management Table 1: Fields for adding or editing a user profile. Setting Description User name Type a user name. Note This field cannot be modified for the default Administrator user profile. New password and Confirm password If necessary, click Change password to display the password fields. User role Select a role from the drop-down list. Type and confirm a password that complies with the password policy for your site.
Overview Tools and Settings 2.3 Tools and Settings To access the Tools and Settings menus, select in the heading for the work area. Menu option Description Full screen Tools User role access Mainly for use with a graphic display. When Fullscreen is selected, the browser bar displays at the top of the screen, but the Status bar and core function pane do not display. Displays for all user roles.
Plant view Plant view user interface 3 Plant view The Plant view core function provides custom graphical views of the current control within your facility. Using graphics that have been created to operate and monitor your facility, Plant view allows you to: ● ● View the present value and current status of objects. Plant view user interface [➙ 18] Command objects to a new value. Commanding objects through a Plant view graphic [➙ 20] 3.
Plant view Plant view user interface ① Root icon and breadcrumb navigation Click root to navigate back to the top-level of the building structure and only display building level graphics. ② Next level in the navigation Click the object name or navigation arrow to display graphics available at the next level of the building structure. ③ Additional object properties Click the icon for the object (ⓐ), for example , to display additional object properties (ⓑ) that are used for engineering graphics.
Plant view Commanding objects through a Plant view graphic 3.2 Commanding objects through a Plant view graphic The Plant view and List view core functions provide the same options for commanding objects. You can place objects Out-of-service or return them to In service, release objects from Manual control, and command objects to a new value. The following figure shows the Siemens sample graphic for controlling a room. ① Object label A label displays for each data point in the graphic.
Plant view Commanding objects through a Plant view graphic ② Command Click Edit ③ to open the Commander dialog box for the object to be commanded. Status icon Icons help you to quickly evaluate the operating status of an environment. For example, the operating mode for this room may display as Protection Comfort ④ , Economy , Pre-comfort or . Link to related graphic Graphics may be linked to other graphics that display related sections of the building structure. Commanding objects 1.
Plant view Commanding objects through a Plant view graphic ① Placing an object Out-of-Service or returning it to In Service The Out of Service toggle button displays for data points that can be placed out-ofservice. ⚫ Click the toggle button to change the object status to In service or Out of service. ② Placing objects into Manual control or returning them to Auto control The Auto/Manual toggle button displays for data points that have a BACnet priority array.
Alarms Commanding objects through a Plant view graphic 4 Alarms The ● Alarms core function allows you to: View current alarm and event entries as Tiles or a List Alarms user interface [➙ 24] ● ● ● ● Siemens Building Technologies View historical alarm events Viewing historical alarm events [➙ 27] Acknowledge alarms, if your user role has this permission Acknowledging current alarms [➙ 28] Configure the following Alarms settings: – Alarm polling – Alarm history – Alarm routing General settings [➙ 69]
Alarms Alarms user interface 4.1 Alarms user interface The Alarms work area displays current alarm and event entries and unacknowledged alarms that have been received since the alarm history was last purged. Configure alarm history [➙ 74] Figure 5: Heading for the Alarms core function. ① The Alarms button has a red shadow when there are active or unacknowledged alarms. ② Root icon and breadcrumb navigation Click the Root icon to display all sites and all alarm and event entries for the sites.
Alarms Alarms user interface ⑥ Acknowledge/Reset or Acknowledge selected toggle button Only displays if a user role has been granted access to acknowledge alarms and when an acknowledgment or reset is required. ● Click Acknowledge/Reset all on current page to acknowledge all alarms or events on the current page. In the List view only, select one or more items and click Acknowledge selected. Work area views Current alarms can be displayed in a Tile or List view. By default, the List view is displayed.
Alarms Alarms user interface ③ Details Displays faults, alarms and unacknowledged events for the object. ④ Date/Time Date and time of the alarm or event transition ⑤ Name Name of the object in alarm, including building structure hierarchy. If an alarm is received from a data point that has not been integrated, the name displays as Device name/Object name. ⑥ Source Device name/Object name. ⑦ Event state The BACnet alarm state. ⑧ Priority Alarm or event priority.
Alarms Viewing historical alarm events Property Description targetDis targetPointDis targetRefDis Name of the object in alarm, including the building structure hierarchy. If the object in alarm is a data point, the targetRefDis and the pointRefDis are the same. timeStamp Date and time of the alarm or event transition 4.2 Viewing historical alarm events The Alarms History view displays the alarms, events and acknowledgments that have been received since the alarm history was last purged.
Alarms Acknowledging current alarms 4.3 Acknowledging current alarms User roles that have been granted access to acknowledge alarms have various options for acknowledging an alarm, which depend on the current work area view. 1. Do one of the following to select the alarms for acknowledging: – – In both the Tile and List views, acknowledge all alarms on the current page by clicking Acknowledge/Reset all on current page. In the Tile view, acknowledge a single alarm by clicking Acknowledge/Reset.
Alarms Alarms tools 4.4 Alarms tools Alarms tools are available to users with the appropriate role assignment. 4.4.1 Workflow for configuring alarm routing This procedure configures alarm routing so that recipients only receive the information that applies to them. For example, a selected list of recipients may only receive an email for an alarm on weekends or during a specific timeframe.
Alarms Alarms tools Table 3: Configure alarm routing dialog box. Setting Description Name Name of the alarm routing configuration. Default: Alarm routing If a configuration is saved with the default name, subsequent default names are Alarm routing n. Email subject The email subject line for the routed alarm. Default: Alarm notifications Email recipients Select one or more email addresses from the predefined list. Press CTRL and click to select multiple items.
Alarms Alarms tools Setting Description Type The type of alarm events that the email recipients receive. Options are: ● Alarm ● Event ● Acknowledgement/Reset Default: All event types are selected State The alarm state values that the email recipients receive.
Alarms Alarms tools 4.4.1.1Editing an alarm routing This procedure modifies an existing alarm routing. Alarms is selected in the core function pane. 1. Select > > Configure alarm routing > . The Edit alarm routings dialog box displays the settings for each schedule. 2. Select an alarm routing from the drop-down list and click Edit. 3. Make the necessary changes in the Configure alarm routing dialog box and click Next. 4. Make the necessary changes in the Alarm filter dialog box. 5.
Alarms Alarms tools 4.4.1.2Purging an alarm routing This procedure removes an alarm routing from the database. Alarms is selected in the core function pane. 1. Select > > Configure alarm routing > . The Purge alarm routings dialog box displays all alarm routings. 2. Select the alarm routing(s) to be removed and click Remove. 3. Click Apply to complete the removal. 4.4.2 Filtering the alarms displayed This procedure filters the Alarms displayed for your current session only.
Alarms Alarms tools Setting Tiles/List description State The alarm state values displayed. Options are: ● Acknowledged/Reset ● Unacknowledged/Not reset ● Alarm/Fault ● Normal History description Default: All selected The logical operator for this setting is OR rather than AND. For example, if Alarm/Fault and Unacknowledged/not reset are selected, any Unacknowledged alarms that are not in Alarm or Fault (Normal), are displayed. Type The type of alarm events displayed.
Scheduler Scheduler user interface 5 Scheduler The Scheduler core function allows you to: ● View the Scheduler and Calendar objects in the database. Scheduler user interface [➙ 35] Managing exception schedules [➙ 44] ● View and modify the Exceptions, which are used to override the weekly schedule. Exception schedules [➙ 41] ● Modify the schedule – Add a new switching point (change of value or setting). – Modify the time, value or setting for a switching point.
Scheduler Scheduler user interface Figure 7: Heading for the Scheduler core function. ① Root icon and breadcrumb navigation Click the Root icon to return to the top level of the hierarchy. Return to any level of the building structure by tapping the item in the breadcrumb list. ② Exceptions / Schedule toggle button Tap to toggle the display between the Schedule and Exceptions calendar views. Exceptions are used to override the weekly schedule. ③ Options button Modifies the Schedule default value.
Scheduler Scheduler user interface Work area views A switching point displays in the work area to indicate the time for a change of value (analog object) or setting (binary or multistate object). Analog object schedule ● Switching points display the value to which the referenced object(s) will be commanded. ● indicates a switching point that returns to the Schedule default.
Scheduler Scheduler user interface 5.1.1 Modifying a schedule This section outlines the following procedures for modifying a schedule: ● Adding a switching point ● Modifying the time of a switching point ● Using the expanded modification controls – Modifying the time – Deleting a switching point – Changing the current value or setting – Returning the object to the Schedule default Adding a switching point Do the following to add a new change of value or setting to the schedule: 1.
Scheduler Scheduler user interface Using the expanded modification controls 1. Tap the switching point to open the switching point widget. The widget heading displays the current switching point time and the current value or setting. 2. Refer to the following figures and legend to complete the desired procedure. 3. To save your modifications, tap Save. Otherwise, tap Cancel to discard all changes made since the schedule was last saved. Expanded analog switching point widget.
Scheduler Modifying the Schedule default 5.2 Modifying the Schedule default The Schedule default is the value to which the schedule controls the referenced object when either of the following situations occurs: ● A switching point is not in control. This would happen on any day during the period of time before the first switching point is scheduled to occur. ● A switching point’s value is set to Return to default.
Scheduler Copying one day’s activities 5.3 Copying one day’s activities Use this procedure to copy the activities of one day to other days in the weekly schedule. 1. Tap Copy. 2. Select the day to be copied and tap Next. When in a reduced weekly view, the currently selected day is automatically selected. 3. Tap to select the day(s) on which the schedule should repeat and then tap Paste. The activities are added to the schedule and saved to the database. 5.
Scheduler Exception schedules 5.4.1 Viewing exceptions for a Scheduler object 1. Display the desired Scheduler object in the work area. 2. Tap Exceptions to display a calendar view of exceptions for the current month. 3. To display a list of all exceptions for the schedule, tap List view. ① Schedule button Click to return to the weekly schedule. ② Calendar and List View buttons Click to display the desired view.
Scheduler Exception schedules ⑤ Profile pane ● Displays the description and time details of the selected exception. ● The Profile pane displays next to the Calendar or List view when the screen width is sufficient. To display the profile when the screen is compressed, tap the date in the Calendar view or select an exception and tap Profile in the List view. ⑥ Multiple exceptions A bold date indicates there are multiple exceptions on the same date.
Scheduler Exception schedules 3. To display a list of all exceptions for the calendar, tap List view. ① Calendar and List View buttons Click to display the desired view. ② Add button ● To quickly add a Date exception, long press on the date in the calendar view. Tap to add a Day, Date range, Weekday or Recurring exception. ③ Current date ④ Recurring exception A dot displays on the date of recurring exceptions.
Scheduler Exception schedules 3. From the Type drop-down list, select Date, Date range, Weekday, or Recurring and tap OK. 4. Do one of the following: – For Date or Date range, enter the desired date(s). – For Weekday or Recurring, select the desired values from the drop-down lists. 5. Tap Next. An exception profile pane displays for the newly-created exception. 6. Long press on the time for the exception to add a switching point widget. 7. If necessary, use the up/down arrows to adjust the time. 8.
Scheduler Exception schedules 3. Tap the exception to delete. The editing view is displayed. 4. Tap Delete and then tap Delete again to confirm the action.
List view Exception schedules 6 List view The List view core function is a customized data point list that allows you to efficiently access the important data points in the system. The ● ● List view core function allows you to: View the present value and current status of objects. List view user interface [➙ 48] Command objects to a new value.
List view List view user interface 6.1 List view user interface Viewing the present value and current status of objects List view is selected in the core function pane. Navigate through the building structure to display the desired objects. The following figure outlines the information displayed in the work area. ⚫ 48 | 80 Siemens Building Technologies ① Object type Icons represent the type of BACnet objects associated with a building, floor, room, or mechanical equipment.
List view Commanding objects in the List view ⑤ Trend data collection indicator Icons indicate if a trend collection is defined for the object and whether the data is being collected online through the Operation application or offline by an end device. Collected data is displayed in the Trends core function. Trends [➙ 50] ⑥ Present value Present value of the data point.
Trends Trends user interface 7 Trends The Operation application supports both online and offline trends. ● For online trends, the Desigo Control Point device collects the trend data. – Trend data for each object can be collected by both timed interval and changeof-value (COV). – The total number of trend definitions allowed is limited by the device type. ● For offline trends, the Desigo Control Point device retrieves data stored in the remote device’s trend objects.
Trends Trends user interface Viewing a saved chart view Trends is selected in the core function pane. 1. Navigate through the building structure to locate the desired chart view. 2. Select a chart view to display it in the work area. The following figure outlines the information displayed in the work area. ① Settings for the displayed chart Select Settings to display or hide the Chart View Settings menu. Save saves the chart to the currently-selected location in the building structure.
Trends Trends user interface ③ Date range selector Trended data can be displayed by the Day, Week, Month, or Year. ● The default display is Today. ● Click the center of the Date range selector to display a calendar for selecting other timeframes. Use the arrows to change the display by one unit of the selected timeframe. For example, if the selected timeframe is Month, selecting ④ Back displays the previous month and selecting Forward displays the next month.
Trends Trends user interface Figure 10: Timeframe restricted to one day. Siemens Building Technologies ● Change the date range selector to a smaller timeframe. For example, from Month to Week or Day. ● Click Chart view ● For chart views containing analog data, adjust the Convolution property in the Series settings. Managing the chart series options [➙ 56] to view the data in a Table , which displays all trend values.
Trends Options for saving chart views 7.2 Options for saving chart views By default, chart views are saved in the Choose Chart View list at the currently- selected location in the building structure. If desired, you can create folders in the Choose Chart View section for saving chart views. Note If you delete all the chart views in a folder, the folder is also deleted. ① Chart views saved at the currently-selected location in the building structure. ② Folders that contain chart views.
Trends Exporting trend data as .csv or .json Saving chart views to a folder Prerequisite A chart view has been created. Adding a chart view [➙ 62] 1. Navigate to the building structure location where you want the chart to reside. 2. Select in the upper left corner of the chart and then select in the Chart View Settings menu. 3. Refer to the following figures to complete the remaining steps. ① Type a name for the chart view.
Trends Managing the chart series options 7.4 Managing the chart series options This section outlines the options for customizing chart views, such as the chart type or color. Trends is selected in the core function pane. 1. Navigate through the building structure to locate the desired chart view. 2. Select a chart view to display it in the work area. ① 3. Select > to display the Series Options dialog box. 4. Select to the left of an object name to display the series options for that object.
Trends Managing the chart series options ⑥ Save Saves the selected Series options to the database and closes the dialog box.. ⑦ Group series Moves a sample set from one chart to another. Moving a chart [➙ 58] Chart view example The following example outlines the Interval, Color, and Chart type properties for a chart view. ① Interval For chart views containing analog data, this property defines the time interval for the x-axis division points.
Trends Managing the chart series options 7.4.1 Moving a chart GROUP SERIES moves the trend data for an object to a new chart or to an existing chart. The following figure displays the options for moving an object to a different chart. ① Create new Moves the selected object to a new chart. ② Chart is not available The selected object can only be moved to an existing chart if the existing chart contains objects from the same device and if the objects have the same unit of measure.
Trends Managing the chart series options 7.4.2 Changing chart colors The Color series option defines the color used to plot the data samples for an object. The default colors are determined by the Trends application. Changing chart colors 1. Open a chart view and select 2. Select > . for the object to be modified. 3. Click the current color sample to display the Color Picker. 4. Do one of the following: – – Select a new color in the Color Picker. Enter the Hex value of a color. 5.
Trends Trends tools 7.5 Trends tools Trends tools are available to users with the appropriate role assignment. 7.5.1 Configuring a scheduled export of trend data to an FTP server or email The model of Desigo Control Point device determines the availability of the trend export function.
Trends Trends tools Table 6: Trend definition dialog box. Setting Description Save every check box Select to record the present value for the selected object(s) at the defined time interval. Default: Not selected Drop-down list The time interval for data collection. Default: 15 seconds Save when value changes check Select to record the present value for the selected object(s) each time box the value changes.
Trends Trends tools Setting Description Time of export The default setting is Weekly, Monday, –. If Field 1 is … Field 2 options Field 3 options Daily – – Weekly Monday Tuesday Wednesday Thursday Friday Saturday Sunday – Monthly Week 1 (Days 1-7) Monday Tuesday Wednesday Thursday Friday Saturday Sunday Week 2 (Days 8-14) Week 3 (Days 15-21) Week 4 (Days 22-28) Week 5 (Days 29-31) The default setting is 05:00 or 5:00 AM, depending on the selected time format.
Trends Trends tools 7.5.3 Editing a trend definition Use this procedure to edit the trend definition for online trended objects. Note To edit a trend definition for an offline trended object, you must use the commissioning program for the device, such as ABT Pro or XWP, and then download the object to the automation station. Editing a trend definition for online trended objects Trends is selected in the core function pane. 1. Select > > Configure trend definitions > . 2.
Trends Trends tools 4. If desired, select the check box to archive collected trend data before removing the trend definition. Otherwise, trend data that was already collected is permanently removed. 5. Click Remove to confirm removal of the trend definition(s). Confirmation of the trend definition removal and data archive (if selected) displays. 6. Click OK to close the dialog box. File information for archived trend data If you choose to archive collected trend data, it is saved as a .
Reports User interface 8 Reports The model of Desigo Control Point device determines the availability of the Reports core function. The ● ● Reports core function allows you to: Display a Point Log report, apply filters to only display selected object types from specific devices and search for specific text in the object properties.
Reports Reports tools ⑥ Download menu Includes the following options: Download - Generate and download a .csv file of the currently displayed data. Email – Send the currently displayed data to an email recipient. This option is not limited to the email recipients in the database. Archive - Archive the currently displayed data for future use. Archived data can also be sent to email recipients in the database or to an FTP server.
Reports Reports tools 3. Click and select . The Archive dialog box displays a file name in the following default format: YYYY_MM_DD_HH_MM_SS_ObjectReport.csv (That is, the current Year, Month, Day, Hour, Minute, Second, based on the computer date and time.) 4. Type a new File name, if desired, and click Create. Confirmation that the report has been archived displays. 5. Click OK to close the dialog box. ② Sending archived reports by email 1. Select > > Send archived reports > . 2.
Reports Reports tools 3. Click and select . The Archive dialog box displays a file name in the following default format: YYYY_MM_DD_HH_MM_SS_ObjectReport.csv (That is, the current Year, Month, Day, Hour, Minute, Second, based on the computer date and time.) 4. Type a new File name, if desired, and click Create. Confirmation that the report has been archived displays. 5. Click OK to close the dialog box. ② Sending archived reports to an FTP server 1.
General settings Reports tools 9 General settings The Settings menu provides general functions for configuring a Desigo Control Point device. Once a device is configured, only occasional updates are required. Access to Settings depends on the user role; most end users do not need daily access to these functions. The following table outlines the Settings that are accessed through . Setting Description SMTP settings Configures an SMTP server to send emails through the Operation application.
General settings Configuring an SMTP server 9.1 Configuring an SMTP server SMTP settings configures an SMTP server to send emails through the Operation application. Common uses for email include alarm notification, automatic email of exported trend data or emailing generated reports. Note Contact your IT department for the proper SMTP settings.
General settings Configuring the FTP settings 9.2 Configuring the FTP settings FTP settings configures the Operation application to save data to a server. The most common use for this feature is transferring trend data to an FTP server for archiving. Note Contact your IT department for the proper FTP settings. Configuring the FTP settings for saving data to a server 1. Select > > FTP settings to display the FTP settings from the project database. 2.
General settings Configuring email recipients 9.3 Configuring email recipients Configure email recipients adds, edits and removes email addresses for those who are receiving emails from the Operation application. Common uses for email include alarm notification, automatic email of exported trend data or emailing generated reports. Adding email recipients to the Operation application 1. Select > > Configure email recipients > . 2.
General settings Data point integration settings Selecting the data point integration settings 1. Select > > Data point integration settings. 2. Complete the fields outlined in the following table. 3. To save the settings, click Apply. Note Each device manufacturer determines what type of update causes the BACnet database revision number to change.
General settings Configuring the alarm poll rate 9.5 Configuring the alarm poll rate The Alarms polling function periodically checks the database to identify any objects with an active alarm state, an acknowledge-required state, or a reset-required state. ● ● Typically, the default Alarm polling settings can be used. For sites with a very high network load, you may need to adjust the Alarm polling settings in order to optimize the performance of the device.
General settings Configuring alarm routing Table 12: Configure alarm history dialog box. Setting Description Purge if older than The default setting is 1 year. Time for purge ● Amount field: Valid entries are numbers greater than 0. ● Unit of measure drop-down list: Days, Weeks, Months, Years or All. The default setting is Daily, –, –.
General settings Local settings Configuring alarm routing Alarms is selected in the core function pane. 1. Select > > Configure alarm routing. 2. Use the following table to make selections in the Configure alarm routing dialog box. 3. To save your selections, click Apply. Table 13: Configure alarm routing dialog box. Setting Description Max.
General settings Local settings ① Name Description Desigo Control Point device Location Modify the location description for the device. Time zone Select the appropriate time zone from the drop down list. Active system language Select the desired system language from the drop down list. Equipment identifier Modify the equipment identifier for the device Description Modify the device description. ② Network port for IP Network number Range is 0 to 65534. UDP port Range is 0 to 65535.
General settings Local settings ③ Name Description Network port for browser connection Screen brightness Use the slider or enter a value to adjust the screen brightness. Note This setting only displays for a PXM touch panel. Screen brightness mode Automatic Manual Screensaver timeout Select the number of minutes the touch panel must be inactive before the screensaver displays. Options are 5, 10, 15, 30, 45 and 60 minutes.
General settings Local settings Siemens Building Technologies 79 | 80 A6V11211557_enUS_b 2019-01-15
Issued by Siemens Industry, Inc. Building Technologies Division 1000 Deerfield Pkwy Buffalo Grove IL 60089 +1 847-215-1000 Document ID: A6V11211557_enUS_b_21 Edition: 2019-01-15 © Siemens Industry, Inc., 2019 Technical specifications and availability subject to change without notice.