
Home Theater Server User Manual

Chapter 8 - Trend View
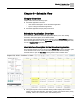
Using the Trend View
51
Siemens Industry, Inc.
125-3584T
You can navigate to other applications while the system is generating a Trend graph.
To cancel a Trend graph, start a new Trend graph, close the trend viewing tab, or log
off Field Panel Web Server.
For more information, see the
Customizing a Trend Graph
section.
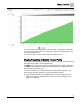
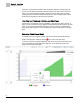
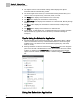
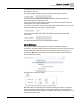
Viewing Trend Data of Multiple Trended Points
The Trending Application allows trended data of up to six (6) points to be viewed at the
same time on one graph or in a single data report.
The Data button in the top left section of the graphs will display a report in a data view
for all points being viewed in the graph. The button allows you to toggle between the
data view and the graphical view.
To view the trended date of multiple trended points, first generate a graph for one
point. See the
Viewing Trend Data of a Single Trended Point
section.
Using the navigation pane, drag additional points or trend log objects onto the
graph in the right pane. Additional point or trend information will display on the
graph in the right pane.