
User Guide

599 Series Zone Valve and Actuator Assembly Selection Technical Bulletin TB254
Document Number 155-291
August 17, 2005
Siemens Industry, Inc. Page 3
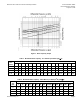
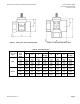
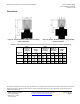
Figure 1. Water Capacity Graph.
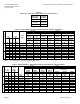
Table 1. Maximum Water Capacity - U.S. Gallons per Minute (ABA).
Valve
Size
Inches
Pressure Differential - psi
Cv\1 2 3 4 5 6 8 10 15 20 25 30 40 50 60 75
.50 1.0 1.4 1.7 2.0 2.2 2.4 2.8 3.2 3.9 4.4 5.0 5.5 6.3 7.1 7.7 8.7
.50 2.5 3.5 4.3 5.0 5.6 6.1 7.1 7.9 9.7 11.2 12.5 13.7 15.8 17.7 19.4 22.0
.50/.75 4.1 5.7 7.1 8.2 9.2 10.0 11.6 13.0 15.9 18.3 20.5 22.4 25.9 29.0 31.8 35.5
1.00 7.0 9.9 12.1 14.0 15.6 17.1 19.8 22.1 27.1 31.3 35.0 38.3 44.3 49.5 54.2 60.6
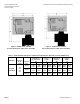
Table 2. Maximum Water Capacity - Cubic Meters per Hour (m
3
/hr) (ABA).
Valve
Size
Mm
Pressure Differential - kPa
1 10 20 30 40 50 60 80 Kvs/ 100
150 200 300 400 500
15 0.9 0.27 0.38 0.47 0.54 0.60 0.66 0.76 0.85 1.04 4.20 1.47 1.70 1.90
15 0.21 0.68 0.96 1.17 1.35 1.51 1.66 1.91 2.15 2.60 3.00 3.70 4.30 4.80
15/20 0.35 1.12 1.59 1.94 2.24 2.51 2.75 3.17 3.50 4.34 5.01 6.14 7.09 7.93
25 0.60 1.91 2.71 3.32 3.83 4.28 4.69 5.41 6.00 7.41 8.56 10.48 12.11 13.54