
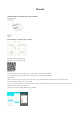
Assembly Instructions
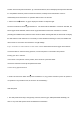
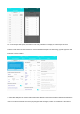

normal, which means the user is in a relaxed state. Select the date of wearing at the top of the data panel to
view the HRV data chart for that day. Sliding chart to average value of heartbeat cycle differences.
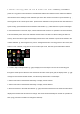
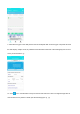
3.1. Click "HRV data" to view average value of heartbeat cycle in every ten minutes and Lorentz scatter
diagram (compared to the reference of Lorentz scatter diagram,
click to view health status corresponding to each diagram).