
User's Manual


RAK7240
RAK7240 User Manual V2.1
11
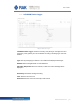
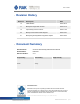
Image 5 | Status
O
verview
Recevied: Shows the total number of LoRa messages received by the LoRa gateway;
Transmittd:
Shows the LoRa message sent by the LoRa gateway;
Active Nodes: Shows the number of active LoRa nodes within the LoRa gateway coverage
(nodes that sent messages in 10 minutes)
Busy Nodes: Shows the number of busy nodes within the LoRa gateway coverage (nodes
with an average message spacing of less than 60s)
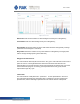
Dutycycle Of LoRa Channel:
The chart shows the
thermodynamic
charts of the "duty cycle" of all channels over time
over a
period of 12 hours. The longitudinal axis is time and the minimum interval is 60s. The
horizontal axis is the channel frequency. Each value represents the average duty cycle of the
channel within 60s (range is: 0%-100%), green represents the low duty cycle, and red
represents the high duty cycle.
LoRa Traffic:
The chart shows the LoRa packet
rate
(
packet/min
)
of each spread factor in two hours.
The vertical axis represents the LoRa packet rate, in packet/min, six colors represent six
spread factors, and the total height represents the sum of all the rates of LoRa packet.