
User's Manual

50
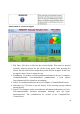
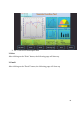
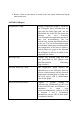
Room Temperature Graph: This graph displays the fluctuations in
roomtemperature during the testing
period. A flag maybe raised if the room
is cold or the roomtemperature
fluctuates. (Please refer to
the“Descriptions of Warning
Flags”section.)Inaddition, if sympathetic
behavior is present, it maybe due to
fluctuating room temperatures. If
thisoccurs, it can be confirmed by
looking for similarbehavior in the room
temperature graph. Forinstance,
temperature decreases in the non-
occludedhand may be due to air
conditioningcycles and this would be
represented as atemperature decrease in
the room.
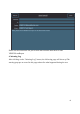
Blood Pressure and Pulse: This graph displays the measurements
takenduring the blood pressure section. It
shows thesystolic, diastolic, and mean
pressure as well as themeasured pulse.
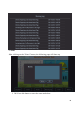
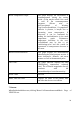
aTR Value: The gauge indicator displays the final
aTR(adjusted temperature rebound)
value. The aTRvalue magnitude directly
correlates with the
extentofthesubject’svascularreactivity
NVRI Value XXXXX
Name, Date and Time Displays the name of the patient, date
and time that the test was takenat.
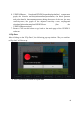
7. Return:
Whenfinishedwiththisscreen,clicking“Return”willreturntheusertotheMain Page of
VENDYS test.