
User's Manual
36
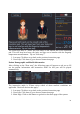
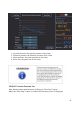
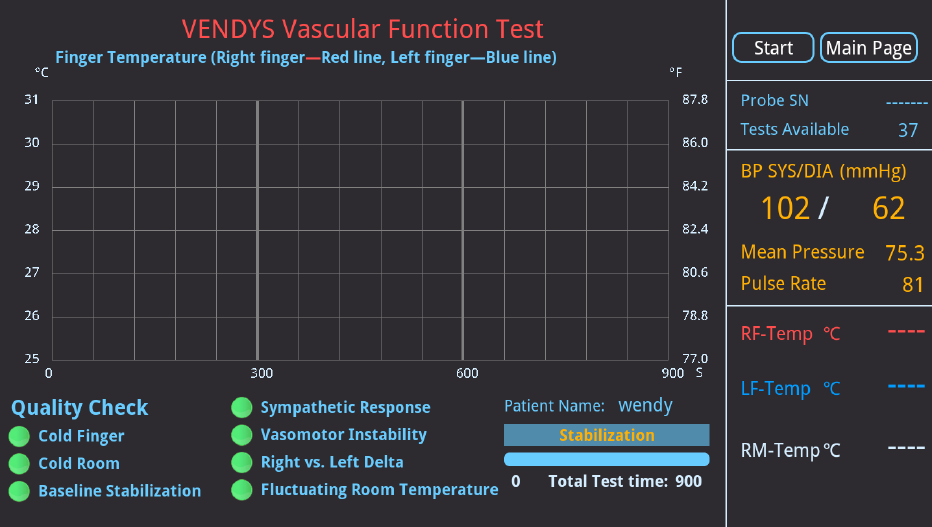
1. Main Page: Click on this button to go back to the main page
2. Start: Click “Start” to allow the VENDYS test to begin
3. Probe SN: Displays the serial number of the temperature probes
4. Test available: Displays the available tests for the current probes
5. Cancel: Stop Test button will show up after clicking on the “Start” Button. If
for any reason you wish to stop the test, click Stop Test.
6. Time: This section will display the amount of time remaining within the
current phase of the VENDYS test and the time remaining for the whole test to
be completed.
7. Temperature Graph: Displays the temperature versustime through the three
phases ofthe VENDYS test.The red trace indicates the right (occluded arm)
finger temperature,while the blue trace indicates the left (non-occluded arm)
fingertemperature.During the three phases of the test, the first five minutes is
thestabilization period. The lines for both hands should indicate astable (nearly
flat)baseline and similar temperatures in both hands.During the inflation
period, the red line should show a nearly lineartemperature drop (after about
30 sec) while the blue light remains nearly constant,indicating a temperature
drop in the occluded hand. During thefinal deflation period, the red lineshould
display a returnto baseline temperature after the occlusion is released.
8. Blood pressure measurement results: The systolic, diastolic pressure, mean
pressure, pulse rate will be displayed here.
9. Temperature Sensors: Shows the temperature readings as numerical values
from thefinger probes in real time. The red reading indicates thetemperature in