
User's Manual

UTT Technologies Chapter 5 System Status
UTT Technologies http://www.uttglobal.com Page 49
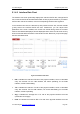
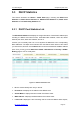
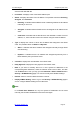
5.1.4.2 Interface Rate Chart
The interface rate chart dynamically displays the real-time RX/TX rate, average RX/TX
rate, maximum RX/TX rate and total RX/TX traffic of each physical interface. If you want to
view the rate chart of an interface, click the corresponding interface name hyperlink.
In the interface rate chart, the abscissa (x-axis) shows the time axis, and the ordinate
(y-axis) shows the real-time RX/TX rate axis. Furthermore, you can adjust some
parameters of the chart if needed, such as the time interval during which the real-time
rates are calculated and displayed, and the displayed colors. Note: The rate chart can only
show the rate and traffic information in the last ten minutes. Each time you open this page,
the rate chart starts anew.
Figure 5-5 Interface Rate Chart
RX: It indicates the real-time RX rate of the physical interface, which is calculated
every two seconds. For the LAN interface, RX means uploading; for the WAN
interface, it means downloading.
TX: It indicates the real-time TX rate of the physical interface, which is calculated
every two seconds. For the LAN interface, TX means downloading; for the WAN
interface, it means uploading.
Avg: It indicates the average RX or TX rate of the physical interface since last
opened the current page.
Peak: It indicates the maximum RX or TX rate of the physical interface since last