
User's Manual

UTT Technologies Chapter 5 System Status
UTT Technologies http://www.uttglobal.com Page 46
Chapter 5 System Status
This chapter describes the system status related pages, which provide a lot of operating
status information and statistics of the Device. By viewing them, the network administrator
can easily analyze the system status and monitor the activities on the Device.
When NAT is enabled, the Device provides a set of powerful monitoring functions, which is
divided into two categories: One is classification statistics, which can help the
administrator find the problems that occurred in the network. The other is real-time
monitoring, which can help the administrator analyze the occurring problem to find out in
which host it happens, what the problem is, and the impact on other hosts.
The management of the Device operating status is divided into two levels:
Ɣ Physical status: The status and statistics for each physical interface, which includes
operating status, ingress and egress traffic statistics, routing table, and so on.
Ɣ NAT status: The status and statistics for every LAN user (i.e., LAN host), which
includes upload and download packets statistics, upload and download rate, total
NAT sessions, and so on.
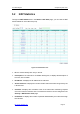
5.1 System Information
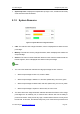
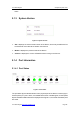
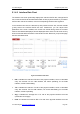
In the Status > System Info page, you may view some system information, which include
system up time, system resource usage status, system version, port status, and interface
rate chart.
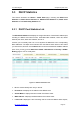
5.1.1 System Up Time
Figure 5-1 System Up Time
System Time: It displays the system current date (YYYY-MM-DD) and time
(HH:MM:SS).